

Inhibition of the Sodium-Potassium-Chloride Cotransporter Isoform-1 reduces glioma invasion
- PMID: 20570904
- PMCID: PMC2896443
- DOI: 10.1158/0008-5472.CAN-09-4666
Inhibition of the Sodium-Potassium-Chloride Cotransporter Isoform-1 reduces glioma invasion
Abstract
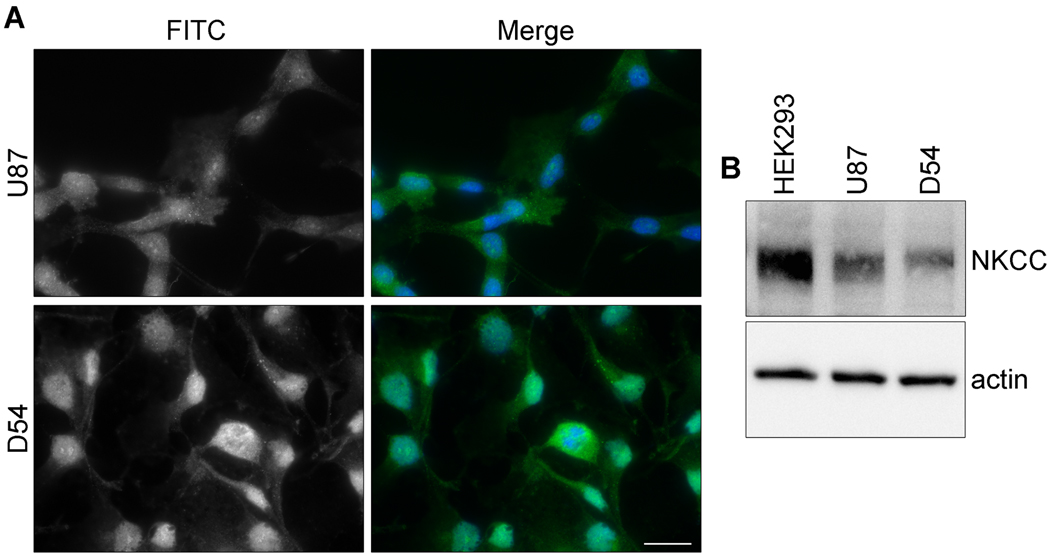
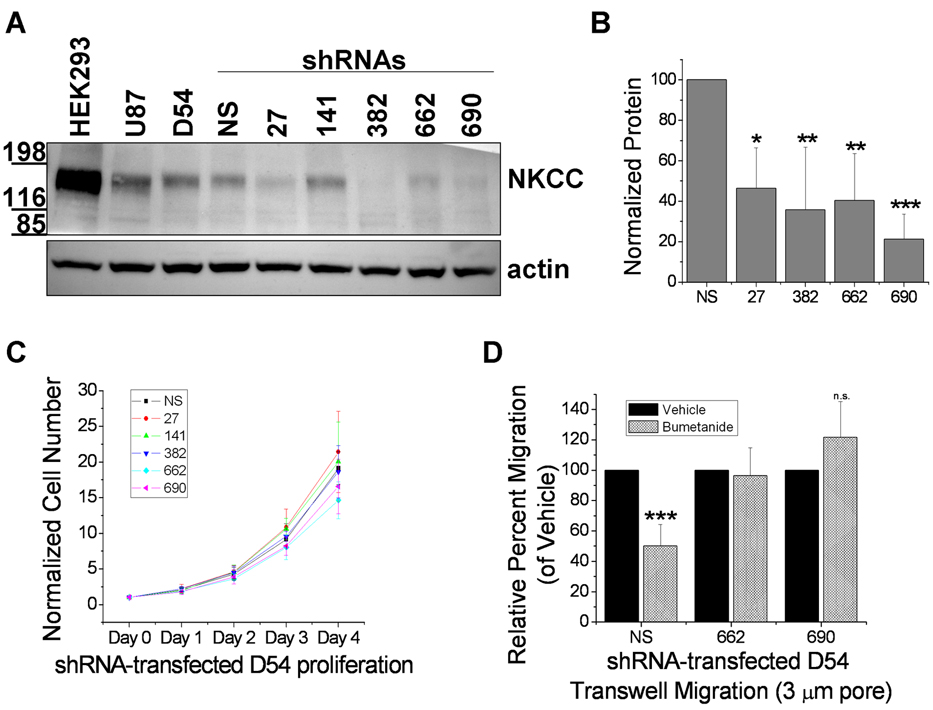
Malignant gliomas metastasize throughout the brain by infiltrative cell migration into peritumoral areas. Invading cells undergo profound changes in cell shape and volume as they navigate extracellular spaces along blood vessels and white matter tracts. Volume changes are aided by the concerted release of osmotically active ions, most notably K(+) and Cl(-). Their efflux through ion channels along with obligated water causes rapid cell shrinkage. Suitable ionic gradients must be established and maintained through the activity of ion transport systems. Here, we show that the Sodium-Potassium-Chloride Cotransporter Isoform-1 (NKCC1) provides the major pathway for Cl(-) accumulation in glioma cells. NKCC1 localizes to the leading edge of invading processes, and pharmacologic inhibition using the loop diuretic bumetanide inhibits in vitro Transwell migration by 25% to 50%. Short hairpin RNA knockdowns of NKCC1 yielded a similar inhibition and a loss of bumetanide-sensitive cell volume regulation. A loss of NKCC1 function did not affect cell motility in two-dimensional assays lacking spatial constraints but manifested only when cells had to undergo volume changes during migration. Intracranial implantation of human gliomas into severe combined immunodeficient mice showed a marked reduction in cell invasion when NKCC1 function was disrupted genetically or by twice daily injection of the Food and Drug Administration-approved NKCC1 inhibitor Bumex. These data support the consideration of Bumex as adjuvant therapy for patients with high-grade gliomas.
Copyright 2010 AACR.
Conflict of interest statement
The authors declare no competing conflicts of interest.
Figures


Similar articles
-
With-No-Lysine Kinase 3 (WNK3) stimulates glioma invasion by regulating cell volume.Am J Physiol Cell Physiol. 2011 Nov;301(5):C1150-60. doi: 10.1152/ajpcell.00203.2011. Epub 2011 Aug 3. Am J Physiol Cell Physiol. 2011. PMID: 21813709 Free PMC article.
-
Regulation of brain tumor dispersal by NKCC1 through a novel role in focal adhesion regulation.PLoS Biol. 2012;10(5):e1001320. doi: 10.1371/journal.pbio.1001320. Epub 2012 May 1. PLoS Biol. 2012. PMID: 22570591 Free PMC article.
-
Inhibition of Na(+)-K(+)-2Cl(-) cotransporter isoform 1 accelerates temozolomide-mediated apoptosis in glioblastoma cancer cells.Cell Physiol Biochem. 2012;30(1):33-48. doi: 10.1159/000339047. Epub 2012 Jun 8. Cell Physiol Biochem. 2012. PMID: 22759954 Free PMC article.
-
The bumetanide-sensitive Na-K-2Cl cotransporter NKCC1 as a potential target of a novel mechanism-based treatment strategy for neonatal seizures.Neurosurg Focus. 2008 Sep;25(3):E22. doi: 10.3171/FOC/2008/25/9/E22. Neurosurg Focus. 2008. PMID: 18759624 Review.
-
Pharmacological tools to target NKCC1 in brain disorders.Trends Pharmacol Sci. 2021 Dec;42(12):1009-1034. doi: 10.1016/j.tips.2021.09.005. Epub 2021 Oct 4. Trends Pharmacol Sci. 2021. PMID: 34620512 Review.
Cited by
-
Identification of novel thyroid cancer-related genes and chemicals using shortest path algorithm.Biomed Res Int. 2015;2015:964795. doi: 10.1155/2015/964795. Epub 2015 Mar 22. Biomed Res Int. 2015. PMID: 25874234 Free PMC article.
-
Light-controlled inhibition of malignant glioma by opsin gene transfer.Cell Death Dis. 2013 Oct 31;4(10):e893. doi: 10.1038/cddis.2013.425. Cell Death Dis. 2013. PMID: 24176851 Free PMC article.
-
Interactions of ion transporters and channels with cancer cell metabolism and the tumour microenvironment.Philos Trans R Soc Lond B Biol Sci. 2014 Feb 3;369(1638):20130098. doi: 10.1098/rstb.2013.0098. Print 2014 Mar 19. Philos Trans R Soc Lond B Biol Sci. 2014. PMID: 24493746 Free PMC article. Review.
-
Ion channels in cancer: future perspectives and clinical potential.Philos Trans R Soc Lond B Biol Sci. 2014 Feb 3;369(1638):20130108. doi: 10.1098/rstb.2013.0108. Print 2014 Mar 19. Philos Trans R Soc Lond B Biol Sci. 2014. PMID: 24493756 Free PMC article. Review.
-
Seizures and gliomas--towards a single therapeutic approach.Nat Rev Neurol. 2016 Apr;12(4):204-16. doi: 10.1038/nrneurol.2016.26. Epub 2016 Mar 11. Nat Rev Neurol. 2016. PMID: 26965673 Review.
References
-
- Hoelzinger DB, Demuth T, Berens ME. Autocrine factors that sustain glioma invasion and paracrine biology in the brain microenvironment. J Natl Cancer Inst. 2007;99:1583–1593. - PubMed
-
- Giese A, Westphal M. Glioma invasion in the central nervous system. Neurosurgery. 1996;39:235–250. - PubMed
-
- Ordaz B, Vaca L, Franco R, Pasantes-Morales H. Volume changes and whole cell membrane currents activated during gradual osmolarity decrease in C6 glioma cells: contribution of two types of K+ channels. AJP - Cell Physiology. 2004;286:C1399–C1409. - PubMed
Publication types
MeSH terms
Substances
Grants and funding
LinkOut - more resources
Full Text Sources
Other Literature Sources
Medical
