Review
. 2010 Jul;137(14):2265-78.
doi: 10.1242/dev.044826.

Modeling bistable cell-fate choices in the Drosophila eye: qualitative and quantitative perspectives

Affiliations
Review

Modeling bistable cell-fate choices in the Drosophila eye: qualitative and quantitative perspectives

Thomas G W Graham et al. Development. 2010 Jul.

Abstract

A major goal of developmental biology is to understand the molecular mechanisms whereby genetic signaling networks establish and maintain distinct cell types within multicellular organisms. Here, we review cell-fate decisions in the developing eye of Drosophila melanogaster and the experimental results that have revealed the topology of the underlying signaling circuitries. We then propose that switch-like network motifs based on positive feedback play a central role in cell-fate choice, and discuss how mathematical modeling can be used to understand and predict the bistable or multistable behavior of such networks.


Figures

Fig. 1.
Fig. 1.
Overview of pattern formation and cell-fate choice in the Drosophila eye. (A) A Nomarski micrograph of a developing third instar larval eye antennal imaginal disc labeled with an antibody to the nuclear photoreceptor marker Elav. A wave of signaling and photoreceptor recruitment associated with a visible indentation in the tissue, the morphogenetic furrow (MF), sweeps across the disc from posterior to anterior. An initial row of R8 ‘founder cells’ is recruited at the posterior edge of the MF, followed by the sequential recruitment of the additional cell types of each ommatidium. Thus, more posteriorly located ommatidia are in more advanced stages of development. To the right is an illustration of the expression pattern of the transcription factor Atonal (Ato) (green) in the vicinity of the MF. Lateral inhibition signaling gradually resolves a broad pattern of Ato expression at the anterior edge of the MF into individual R8 progenitor cells. Adapted with permission from Voas and Rebay (Voas and Rebay, 2004). (B) A simplified schematic showing the sequence of inductive signaling events leading to the specification of photoreceptors (R8; R2, R5; R3, R4; R1, R6; R7) and cone cells (C) within a single ommatidium. Colored arrows represent different signaling events, whereas the large white arrows indicate the progression of time. The receptor tyrosine kinase (RTK) ligand Spitz is produced by differentiated photoreceptors to induce the differentiation of subsequent cell types (blue arrows).
Fig. 2.
Fig. 2.
Mathematical models of bistability. (A) A bistable switch may be built from a single protein (X) that induces its own expression (curved arrow). To model this self-induction, the production rate of X is taken here to be an increasing Hill function of the concentration of X. Plotted on the graph are rates of production (gray) and degradation (black) of X (vertical axis) as a function of the concentration of X (horizontal axis). Steady states (red and blue points) exist where the production rate of X [g(x)] is equal to its degradation rate (bx). These steady states may be stable (blue) or unstable (red). The difference in the X production and degradation rates will cause the system to return to the stable points following small perturbations. However, small perturbations from the unstable point will tend to be amplified, causing the system to ‘run away’ from the unstable point towards one of the two stable points. (B) A bistable switch may also be built from two factors (X and Y) that repress the production of each other. Here, this mutual antagonism is represented mathematically by modeling the production rate of one factor as a decreasing Hill function of the concentration of the other factor. The horizontal and vertical axes of the plot correspond to concentrations of X and Y, respectively, and the gray and black curves are the solutions to the steady-state equations dx/dt=0 and dy/dt=0, respectively. The intersections between these two curves represent steady-state points at which the concentrations of both X and Y are unchanging. As in A, two of these steady states are stable, whereas the intermediate steady state is unstable. (C) An alternative choice of parameters for the network in B (red arrow) can reduce the number of stable solutions to one, turning a bistable network into a monostable network. This emphasizes that the behavior of bistable networks depends crucially on the quantitative details of interactions within the network.
Fig. 3.
Fig. 3.
Two intracellular bistable cell-fate switches in Drosophila eye development. (A) The pale versus yellow switch. Pale and yellow subtypes of the R7 and R8 photoreceptors are distinguished by expression of different light-sensitive rhodopsin (Rh) proteins. Within R8, the signaling molecules Warts (Wts) and Melted (Melt) exhibit mutual transcriptional antagonism via a presumably indirect mechanism that has yet to be elucidated. Melt expression promotes the pale subtype in R8, whereas Wts expression promotes the yellow subtype. An upstream pale versus yellow cell-fate decision in the neighboring R7 cell influences the Wts/Melt switch in R8 via an unknown juxtacrine signal (X). Active components and connections are green, whereas inactive ones are gray. Relatively well-established connections are shown by solid lines; in other figures, poorly understood or speculative interactions are shown by dotted lines. (B) The R2/5 versus R8 switch in the R8 equivalence group of cells (see Fig. 1A). The R8 and R2/5 cell-fate determinants Senseless (Sens) and Rough (Ro) repress each other cell-autonomously. Sens is also engaged in a mutual-activation loop with the transcription factor Ato, the expression of which is initially refined to a single cell per cluster through Notch-mediated lateral inhibition.
Fig. 4.
Fig. 4.
An intercellular switch that distinguishes R3 from R4. Delta/Notch signaling and possibly also planar cell polarity (PCP) signaling are involved in generating a bistable switch that distinguishes between photoreceptors R3 and R4 in the developing Drosophila eye imaginal disc. Notch signaling promotes bistability via intracellular cross-antagonism and intercellular cross-activation between Notch and its ligand Delta. Frizzled (Fz) signaling preferentially activates Delta in the cell nearer the equator, causing it to become R3 while inducing its neighbor to become R4. Heterotypic association of different PCP complexes across the interface between the two cells, together with putative intracellular cross-antagonism in the formation of the two complexes, may also generate bistability by exploiting the same basic principle used by the Delta/Notch switch. In addition to activating Delta expression, Fz serves as a core component of the PCP signaling pathway, although it remains unclear how these two functions of Fz are related. For key, see Fig. 3 legend.
Fig. 5.
Fig. 5.
The Yan network switch. Putative role of the Yan network as a bistable switch that regulates differentiation in the eye imaginal disc. (A) The Yan network consists of a group of regulators downstream of RTK signaling. The ‘core’ of the network comprises the transcriptional repressor Yan and three other factors (PntP1, Mae and miR-7), with which Yan is mutually antagonistic. In the absence of RTK signaling, the network exists in a high-Yan state, which prevents cells from differentiating prematurely. (B) In response to a transient pulse of RTK signal, Mapk phosphorylates and inactivates Yan while inducing its antagonists. (C) In our proposed bistable switch model, this transient stimulus induces a sustained transition from a stable high-Yan state to a stable high-PntP1, high-Mae, high-miR-7 state that drives differentiation. For key, see Fig. 3 legend.
Fig. 6.
Fig. 6.
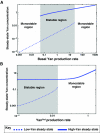
Sensitivity of the Yan network model to specific parameter choices. Our model of the Yan network demonstrates how changing specific parameters can influence whether the network is monostable or bistable (for more on this model, see Simulation 2 and Tables S1-S4 in the supplementary data for parameter choices used in our simulations of the model). (A) Changing a single parameter, i.e. the maximal production rate of Yan, while keeping other parameters constant, can change the number of stable states available to the network. Levels of Yan at different stable states are shown as a function of the maximal Yan production rate (plotted on a logarithmic scale). Two possible stable states (indicated by solid and dashed curves) coexist in the bistable region (gray), whereas only one solution exists in the monostable regions. Bistability of the network is lost when the basal production rate of Yan is tuned to be either too high or too low. (B) A similar diagram for the model that includes YanAct, the non-phosphorylatable constitutive repressor mutant of Yan. Possible steady-state levels of total Yan (endogenous Yan + YanAct) are plotted versus the logarithm of the production rate of YanAct (the variable parameter). The system begins in a bistable state (shaded), but bistability is destroyed by expressing a sufficient amount of YanAct, which reduces the number of stable solutions from two to one.
Fig. 7.
Fig. 7.
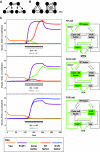
Schemes for coupling bistable switches into multistable networks. The ‘attractive landscape’ hypothesis of cell-fate choice (Waddington, 1957; Kauffman, 1969; Huang, 2009) proposes that different cell types correspond to distinct attractors in the dynamics of multistable genetic and signaling networks. Two schemes are illustrated by which multistable networks can be built from simpler bistable components and the output of a mathematical model that embodies both strategies is presented. (A) Hierarchical activation by upstream switches of increasingly fate-specific downstream switches gives rise to a tree of branching fate decisions (Cinquin and Demongeot, 2002; Foster et al., 2009; Wang et al., 2009; Artyomov et al., 2010). Here, and in B, circles represent idealized ‘factors’ that regulate cell-fate choice. (B) Horizontal coupling of switches into a network of mutual antagonists may provide multipotent progenitors with simultaneous access to several mutually exclusive fates. (C) Output of the multiple bistable switch model for fate choice in the Drosophila eye imaginal disc R7 equivalence group, demonstrating how different combinations of transient RTK and Notch signals can flip the switch in the direction of one of the three cell-fate-specific factors. (Left) Plots show results from numerical simulations of our mathematical model in response to different combinations of RTK and Notch signals. The period during which the signals were transiently applied is indicated by black (RTK) and gray (Notch) horizontal lines. (Right) The components that are active (green) and inactive (gray) at the end of each simulation. When stimulated with RTK signal below a critical threshold, the switch returns to its initial high-Yan state (not shown). For more on this model, see Simulation 1 in the supplementary material.

Similar articles

Cited by

References

    1. Ackers G. K., Johnson A. D., Shea M. A. (1982). Quantitative model for gene regulation by lambda phage repressor. Proc. Natl. Acad. Sci. USA 79, 1129-1133 - PMC - PubMed
    1. Albeck J. G., Burke J. M., Spencer S. L., Lauffenburger D. A., Sorger P. K. (2008). Modeling a snap-action, variable-delay switch controlling extrinsic cell death. PLoS Biol. 6, 2831-2852 - PMC - PubMed
    1. Amonlirdviman K., Khare N. A., Tree D. R. P., Chen W.-S., Axelrod J. D., Tomlin C. J. (2005). Mathematical modeling of planar cell polarity to understand domineering nonautonomy. Science 307, 423-426 - PubMed
    1. Arkin A., Ross J., McAdams H. H. (1998). Stochastic kinetic analysis of developmental pathway bifurcation in phage lambda-infected Escherichia coli cells. Genetics 149, 1633-1648 - PMC - PubMed
    1. Artyomov M. N., Meissner A., Chakraborty A. K. (2010). A model for genetic and epigenetic regulatory networks identifies rare pathways for transcription factor induced pluripotency. PLoS Comput. Biol. 6, e1000785 - PMC - PubMed

Publication types

LinkOut - more resources