

Large inverted repeats within Xp11.2 are present at the breakpoints of isodicentric X chromosomes in Turner syndrome
- PMID: 20570968
- PMCID: PMC2916707
- DOI: 10.1093/hmg/ddq250
Large inverted repeats within Xp11.2 are present at the breakpoints of isodicentric X chromosomes in Turner syndrome
Abstract
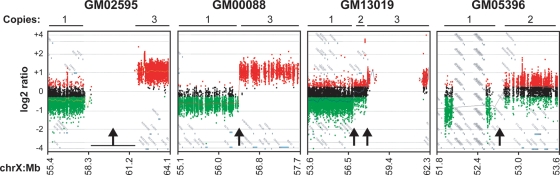
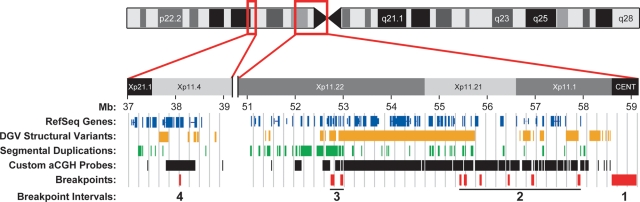
Turner syndrome (TS) results from whole or partial monosomy X and is mediated by haploinsufficiency of genes that normally escape X-inactivation. Although a 45,X karyotype is observed in half of all TS cases, the most frequent variant TS karyotype includes the isodicentric X chromosome alone [46,X,idic(X)(p11)] or as a mosaic [46,X,idic(X)(p11)/45,X]. Given the mechanism of idic(X)(p11) rearrangement is poorly understood and breakpoint sequence information is unknown, this study sought to investigate the molecular mechanism of idic(X)(p11) formation by determining their precise breakpoint intervals. Karyotype analysis and fluorescence in situ hybridization mapping of eight idic(X)(p11) cell lines and three unbalanced Xp11.2 translocation lines identified the majority of breakpoints within a 5 Mb region, from approximately 53 to 58 Mb, in Xp11.1-p11.22, clustering into four regions. To further refine the breakpoints, a high-resolution oligonucleotide microarray (average of approximately 350 bp) was designed and array-based comparative genomic hybridization (aCGH) was performed on all 11 idic(X)(p11) and Xp11.2 translocation lines. aCGH analyses identified all breakpoint regions, including an idic(X)(p11) line with two potential breakpoints, one breakpoint shared between two idic(X)(p11) lines and two Xp translocations that shared breakpoints with idic(X)(p11) lines. Four of the breakpoint regions included large inverted repeats composed of repetitive gene clusters and segmental duplications, which corresponded to regions of copy-number variation. These data indicate that the rearrangement sites on Xp11.2 that lead to isodicentric chromosome formation and translocations are probably not random and suggest that the complex repetitive architecture of this region predisposes it to rearrangements, some of which are recurrent.
Figures


Similar articles
-
[Prenatal diagnosis and genetic analysis of two cases of Turner syndrome due to isodicentric Xp11.22].Zhonghua Yi Xue Yi Chuan Xue Za Zhi. 2023 Mar 10;40(3):368-373. doi: 10.3760/cma.j.cn511374-20210911-00743. Zhonghua Yi Xue Yi Chuan Xue Za Zhi. 2023. PMID: 36854417 Chinese.
-
Evidence of a mechanism for isodicentric chromosome Y formation in a 45,X/46,X,idic(Y)(p11.31)/46,X,del(Y)(p11.31) mosaic karyotype.Eur J Med Genet. 2011 Mar-Apr;54(2):161-4. doi: 10.1016/j.ejmg.2010.11.002. Epub 2010 Nov 13. Eur J Med Genet. 2011. PMID: 21078420
-
[A case of Turner syndrome with double pseudo-isodicentric X chromosome and mosaic karyotype diagnosed prenatally and a literature review].Zhonghua Yi Xue Yi Chuan Xue Za Zhi. 2025 Jun 10;42(6):756-761. doi: 10.3760/cma.j.cn511374-20250423-00244. Zhonghua Yi Xue Yi Chuan Xue Za Zhi. 2025. PMID: 40763976 Review. Chinese.
-
Correlation of intercentromeric distance, mosaicism, and sexual phenotype: molecular localization of breakpoints in isodicentric Y chromosomes.Am J Med Genet A. 2011 Nov;155A(11):2705-12. doi: 10.1002/ajmg.a.34260. Epub 2011 Sep 30. Am J Med Genet A. 2011. PMID: 21964771
-
De novo isodicentric X chromosome: 46,X,idic(X)(q24), and summary of literature.Am J Med Genet A. 2006 Apr 15;140(8):923-30. doi: 10.1002/ajmg.a.31184. Am J Med Genet A. 2006. PMID: 16528747 Review.
Cited by
-
FoSTeS, MMBIR and NAHR at the human proximal Xp region and the mechanisms of human Xq isochromosome formation.Hum Mol Genet. 2011 May 15;20(10):1925-36. doi: 10.1093/hmg/ddr074. Epub 2011 Feb 24. Hum Mol Genet. 2011. PMID: 21349920 Free PMC article.
-
Origin-dependent inverted-repeat amplification: a replication-based model for generating palindromic amplicons.PLoS Genet. 2011 Mar;7(3):e1002016. doi: 10.1371/journal.pgen.1002016. Epub 2011 Mar 17. PLoS Genet. 2011. PMID: 21437266 Free PMC article. No abstract available.
-
Multi-ethnic cytochrome-P450 copy number profiling: novel pharmacogenetic alleles and mechanism of copy number variation formation.Pharmacogenomics J. 2013 Dec;13(6):558-66. doi: 10.1038/tpj.2012.48. Epub 2012 Nov 20. Pharmacogenomics J. 2013. PMID: 23164804 Free PMC article.
-
Sex-specific DNA-replication in the early mammalian embryo.Nat Commun. 2024 Jul 27;15(1):6323. doi: 10.1038/s41467-024-50727-w. Nat Commun. 2024. PMID: 39060312 Free PMC article.
-
Single-nucleotide polymorphism array genotyping is equivalent to metaphase cytogenetics for diagnosis of Turner syndrome.Genet Med. 2014 Jan;16(1):53-9. doi: 10.1038/gim.2013.77. Epub 2013 Jun 6. Genet Med. 2014. PMID: 23743550 Free PMC article.
References
-
- Lippe B. Turner syndrome. Endocrinol. Metab. Clin. North Am. 1991;20:121–152. - PubMed
-
- Zinn A.R., Page D.C., Fisher E.M. Turner syndrome: the case of the missing sex chromosome. Trends Genet. 1993;9:90–93. doi:10.1016/0168-9525(93)90230-F. - DOI - PubMed
-
- Howell R.T., Roberts S.H., Beard R.J. Dicentric X isochromosomes in man. J. Med. Genet. 1976;13:496–500. doi:10.1136/jmg.13.6.496. - DOI - PMC - PubMed
-
- Melaragno M.I., Fakih L.M., Cernach M.C., Maccagnan P. Isodicentric X chromosome and mosaicism: report on two cases of 45,X/46,X,idic(Xq)/47,X,idic(Xq),idic(Xq) and review of the literature. Am. J. Med. Genet. 1993;47:357–359. doi:10.1002/ajmg.1320470312. - DOI - PubMed
-
- Schmid W., Naef E., Murset G., Prader A. Cytogenetic findings in 89 cases of Turner's syndrome with abnormal karyotypes. Humangenetik. 1974;24:93–104. - PubMed
Publication types
MeSH terms
Grants and funding
LinkOut - more resources
Full Text Sources
Medical
Miscellaneous
