. 2010 Sep 10;285(37):28826-37.
doi: 10.1074/jbc.M109.099424. Epub 2010 Jun 22.

Deficiency of chemokine receptor CCR1 causes osteopenia due to impaired functions of osteoclasts and osteoblasts

Affiliations

Deficiency of chemokine receptor CCR1 causes osteopenia due to impaired functions of osteoclasts and osteoblasts

Akiyoshi Hoshino et al. J Biol Chem. .

Abstract

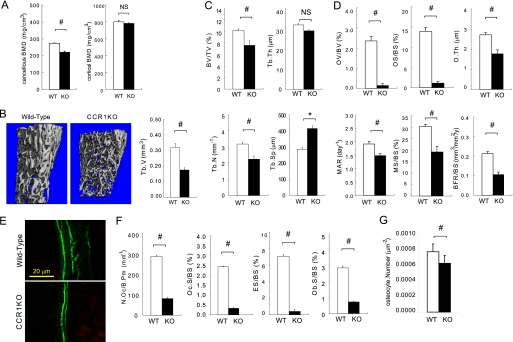
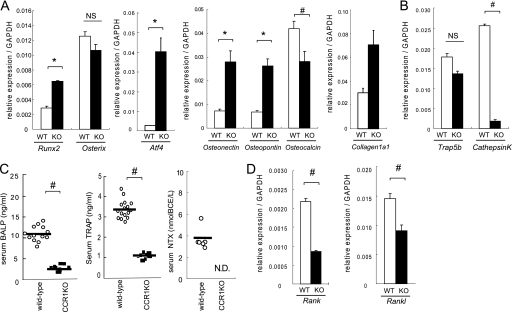
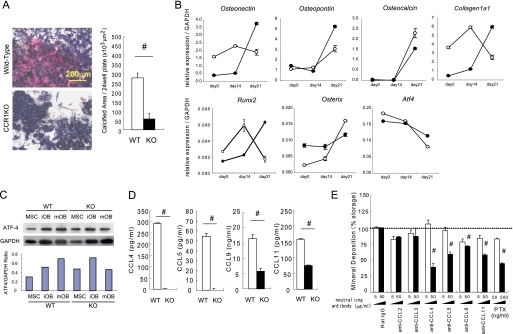
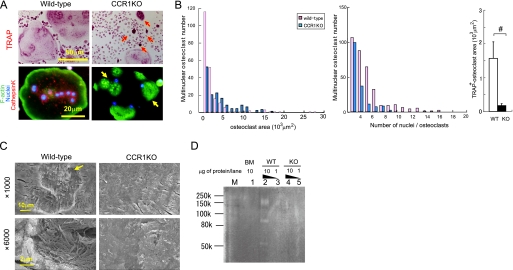
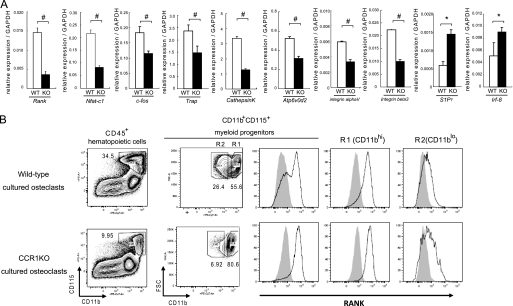
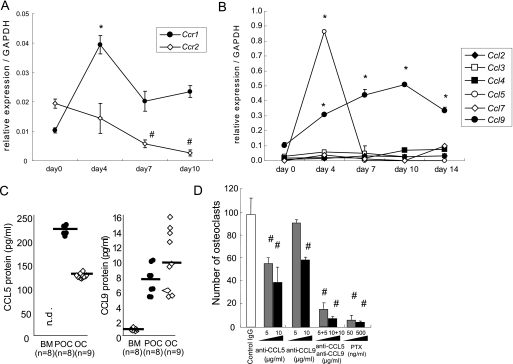
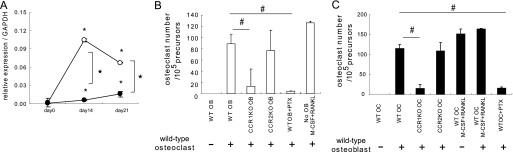
Chemokines are characterized by the homing activity of leukocytes to targeted inflammation sites. Recent research indicates that chemokines play more divergent roles in various phases of pathogenesis as well as immune reactions. The chemokine receptor, CCR1, and its ligands are thought to be involved in inflammatory bone destruction, but their physiological roles in the bone metabolism in vivo have not yet been elucidated. In the present study, we investigated the roles of CCR1 in bone metabolism using CCR1-deficient mice. Ccr1(-/-) mice have fewer and thinner trabecular bones and low mineral bone density in cancellous bones. The lack of CCR1 affects the differentiation and function of osteoblasts. Runx2, Atf4, Osteopontin, and Osteonectin were significantly up-regulated in Ccr1(-/-) mice despite sustained expression of Osterix and reduced expression of Osteocalcin, suggesting a lower potential for differentiation into mature osteoblasts. In addition, mineralized nodule formation was markedly disrupted in cultured osteoblastic cells isolated from Ccr1(-/-) mice. Osteoclastogenesis induced from cultured Ccr1(-/-) bone marrow cells yielded fewer and smaller osteoclasts due to the abrogated cell-fusion. Ccr1(-/-) osteoclasts exerted no osteolytic activity concomitant with reduced expressions of Rank and its downstream targets, implying that the defective osteoclastogenesis is involved in the bone phenotype in Ccr1(-/-) mice. The co-culture of wild-type osteoclast precursors with Ccr1(-/-) osteoblasts failed to facilitate osteoclastogenesis. This finding is most likely due to a reduction in Rankl expression. These observations suggest that the axis of CCR1 and its ligands are likely to be involved in cross-talk between osteoclasts and osteoblasts by modulating the RANK-RANKL-mediated interaction.


Figures

FIGURE 1.
FIGURE 1.
Bone morphometric analyses of CCR1−/− mice. A shows the bone mineral density of trabecular and cortical bones in distal femurs as measured by peripheral quantitative CT. B shows the microCT images and the quantitative measurements of trabecular bones (Tb.V.) in the distal femurs of wild-type and Ccr1−/− mice (n = 10). In C–F, the bone histomorphometric analyses of distal femurs in wild-type and CCR1−/− mice were carried out as described under “Experimental Procedures.” Parameters relating to the trabecular structure (in C): bone volume per tissue volume (BV/TV), trabecular number (Tb.N.), and trabecular separation (Tb.Sp.). Parameters relating to bone formation (in D): osteoid volume to bone volume (OV/BV), osteoid surface/bone surface (OS/BS), osteoid thickness (O.Th.), formation rate referenced to bone surface (BFR/BS), mineral apposition rate (MAR), and mineralizing surface per bone surface (MS/BS). The immunofluorescence images of calcein labeling in wild-type and Ccr1−/− mice (in E). Parameters relating to bone resorption (in F): osteoclast number per bone perimeter (N.Oc./B.Pm), osteoclast surface per bone surface (Oc.S./BS), eroded surface per bone surface (ES/BS), and osteoblast surface per bone surface (Ob.S./BS). The bone histomorphometric analysis data are represented as the mean ± S.E. obtained from six mice in each group. #, significantly different from wild-type controls, p < 0.05. In G, osteocyte numbers per area are represented as the mean ± S.E. obtained from three mice in each group.
FIGURE 2.
FIGURE 2.
Expression of markers related to osteoblasts and osteoclasts in bones and sera in wild-type and CCR1−/− mice. In A, B, and D, total RNAs were isolated form the proximal tibia of wild-type and Ccr1−/− male mice at 8 weeks of age. Real-time Q-PCR revealed the relative expression levels of osteoblast-related mRNAs (Runx-2, Osterix, Atf4, Osteonectin, Osteopontin, Osteocalcin, and Collagen1α1, A), osteoclast-related mRNA (Trap5a and Cathepsin K, B), and RANK–RANKL axis (Rank and Rankl, D). Data are expressed as the copy numbers of these markers normalized to Gapdh expression (mean ± S.E., n = 8). In C, the levels of serum BALP, TRAP, and serum collagen-type1 N-telopeptides (NTx) were measured by ELISA. The bars indicate the mean ± S.E. Each sample was duplicated. Wild-type and Ccr1−/− male mice at 9 weeks of age (n = 10 and 6, respectively) were subjected to BALP and TRAP. Wild-type and Ccr1−/− male mice at 9–13 weeks of age (n = 8 and 6, respectively) were assayed for NTx. #, significantly different from wild-type controls, p < 0.05. N.D., not detected.
FIGURE 3.
FIGURE 3.
Impaired mineralized nodule formation in CCR1-deficient osteoblastic cells. In A, osteoblastic cells were cultured from the bone marrow of wild-type and Ccr1−/− mice, and then minerals were stained with alizarin red and BALP with chromogenic reagents (shown in “blue”) (magnification ×100, left). Mineral deposition was determined by von Kossa staining (n = 6, right). In B, total RNAs were isolated from osteoblastic cells isolated from wild-type (open circles) and Ccr1−/−mice (filled circles). The real-time Q-PCR analyses examined the relative expression levels of osteoblast-related transcriptional factor mRNAs (Runx-2, Osterix, and Atf4) and osteoblast-related marker mRNAs (Osteonectin, Osteopontin, Osteocalcin, and Collagen1α1). Data are expressed as the copy numbers of these markers normalized to Gapdh expression (mean ± S.E., n = 8). In C, the protein expression levels of the transcriptional factor ATF4 by wild-type and Ccr1−/− osteoblastic cells were measured by a Western blot analysis. Osteoblast lysates (10 μg of protein per lane) was loaded and separated by SDS-PAGE. The expression levels of ATF4 were normalized to GAPDH expression. In D, the production of CCR1-related chemokine ligands in the culture media of wild-type and Ccr1−/− osteoblastic cells was measured by ELISA (n = 5). #, significantly different from wild-type controls, p < 0.05. In E, osteoblastic cells were cultured with the indicated neutralizing antibodies against chemokines. The mineral deposition rate was measured by von Kossa staining (n = 4). Stained cells cultured with control rat IgG were set as 100%. #, significantly different from between different concentrations of each antibody, p < 0.05. PTX, pertussis toxin.
FIGURE 4.
FIGURE 4.
Essential roles of CCR1 in multinucleation and bone-resorbing activity. Pre-osteoclastic cells were cultured from the bone marrow of wild-type and Ccr1−/− mice. Osteoclasts were induced from the pre-osteoclastic cells by M-CSF and RANKL treatment. In A, the formation of multinuclear osteoclasts by wild-type and Ccr1−/− precursors was visualized by TRAP chromogenic staining (magnification ×400, upper panels). Immunohistochemical staining was carried out using an anti-cathepsin K antibody conjugated with Alexa594 (red). F-actin and nuclei were counterstained by phalloidin-AlexaFluor 488 (green) and Hoechst 33258 (blue), respectively (magnification ×640, bottom panels). The yellow arrow indicates multinuclear giant cells with an impaired actin ring rearrangement, and the red arrows indicate TRAP accumulation. In B, histograms of the area distribution of multinuclear osteoclasts delimited with phalloidin, and of the number of multinuclear osteoclasts in A. Area comprises TRAP-positive multinuclear (>3 nuclei) giant cells shown in A (mean ± S.E., n = 3). In C, pit formation by wild-type and Ccr1−/− osteoclasts on bone slice observed by scanning electron microscopy (magnification: ×1000 (top) and ×6000 (bottom), respectively). In D, collagen digestion activity by wild-type and Ccr1−/− osteoclasts was measured by collagen-based zymography. Lanes M, 1, 2–3, and 4–5 indicate the molecular markers, bone marrow-derived macrophage lysates (10 μg of protein/lane), wild-type osteoclast lysates (1 and 10 μg of protein/lane), and Ccr1−/− osteoclasts lysates (1 and 10 μg of protein/each lane), respectively.
FIGURE 5.
FIGURE 5.
Osteoclastic impairment by CCR1 deficiency is due to the changes in osteoclastic precursor population. Pre-osteoclastic cells were cultured from the bone marrow of wild-type and Ccr1−/− mice. Osteoclasts were induced from the pre-osteoclastic cells by M-CSF and RANKL treatment. In A, relative expression levels of the osteoclastic differentiation markers (Rank, Nfatc1 transcription factor, c-fos, Trap, CathepsinK protease, H+-ATPase subunit ATP6v0d2, integrins αV and β3, S1P1, and Irf-8) on wild-type (open column) and Ccr1−/− (filled column) osteoclasts were measured by a real-time Q-PCR analysis at day 4 after culture (mean ± S.E., n = 5). #, significantly different from wild-type controls, p < 0.05. In B, expression analysis of RANK in CD45+CD11b+CD115+ pre-osteoclastic cells isolated from the bone marrows of wild-type and Ccr1−/− mice after 4 days in culture were analyzed by flow cytometry.
FIGURE 6.
FIGURE 6.
CCR1 signaling is involved in osteoclast differentiation. Osteoclastic cells and macrophages were cultured from the bone marrow of wild-type and Ccr1−/− mice. Total RNAs were isolated from the cultured cells. The relative mRNA expression levels of chemokine receptors Ccr1, Ccr2 (A) and chemokine ligands (B) during osteoclastogenesis were measured by real-time Q-PCR (mean ± S.E., n = 5). * and #, significantly different from day 0 of Ccr1 and Ccr2, respectively, p < 0.05 in A. *, significantly different from day 0 of culture in each ligand expression, p < 0.05 in B. In C, chemokine levels during osteoclastogenesis were measured by ELISA. BM, bone marrow-derived macrophage; POC, pre-osteoclast (day 4); and OC, osteoclast (day14). Bars indicate the mean. In D, the number of osteoclasts after neutralization of CCL5, CCL9, and their combination in the osteoclastic cultures were scored (mean ± S.E., n = 3). #, significantly different between two distinct concentrations of each antibody, p < 0.05. PTX, pertussis toxin.
FIGURE 7.
FIGURE 7.
CCR1 is involved in the RANK–RANKL axis and induces the impaired osteoclastogenesis. In A, osteoblastic cells were cultured from the bone marrow of wild-type and Ccr1−/− mice. Relative expression levels of Rankl by Ccr1−/− osteoblasts as measured by real-time Q-PCR (mean ± S.E., n = 3). #, significantly different from wild-type controls, p < 0.05. In B and C, the number of TRAP+ multinuclear osteoclasts induced by co-culture with osteoblasts. Co-culture with osteoblastic cells isolated from wild-type or Ccr1−/− mice (mean ± S.E., duplicated, n = 2, B), and with osteoclast precursors isolated from wild-type or Ccr1−/− mice (mean ± S.E., duplicated, n = 2, C). Osteoclast cultures with M-CSF and RANKL without osteoblasts were set as positive control. #, significantly different from co-culture of osteoclasts with wild-type osteoblasts, p < 0.05.

Similar articles

Cited by

References

    1. Charo I. F., Ransohoff R. M. (2006) N. Engl. J. Med. 354, 610–621 - PubMed
    1. Oba Y., Lee J. W., Ehrlich L. A., Chung H. Y., Jelinek D. F., Callander N. S., Horuk R., Choi S. J., Roodman G. D. (2005) Exp. Hematol. 33, 272–278 - PubMed
    1. Kim M. S., Magno C. L., Day C. J., Morrison N. A. (2006) J. Cell Biochem. 97, 512–518 - PubMed
    1. Menu E., De Leenheer E., De Raeve H., Coulton L., Imanishi T., Miyashita K., Van Valckenborgh E., Van Riet I., Van Camp B., Horuk R., Croucher P., Vanderkerken K. (2006) Clin. Exp. Metastasis 23, 291–300 - PubMed
    1. Haringman J. J., Smeets T. J., Reinders-Blankert P., Tak P. P. (2006) Ann. Rheum. Dis. 65, 294–300 - PMC - PubMed

Publication types

MeSH terms