. 2010 Aug 20;285(34):26558-69.
doi: 10.1074/jbc.M109.063255. Epub 2010 Jun 22.

Phenethyl isothiocyanate inhibits oxidative phosphorylation to trigger reactive oxygen species-mediated death of human prostate cancer cells

Affiliations

Phenethyl isothiocyanate inhibits oxidative phosphorylation to trigger reactive oxygen species-mediated death of human prostate cancer cells

Dong Xiao et al. J Biol Chem. .

Abstract

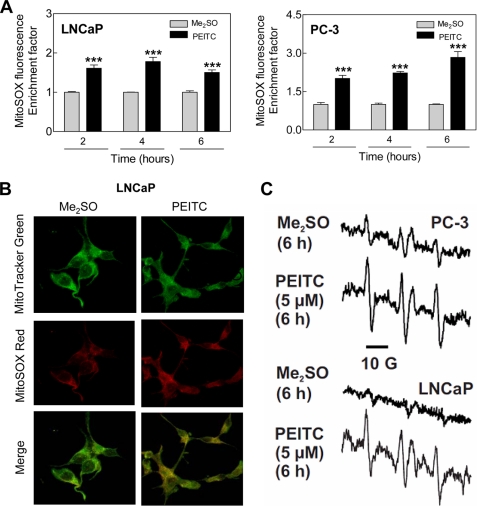
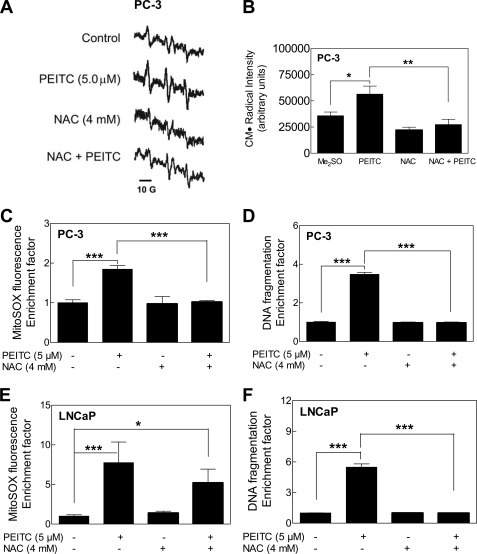
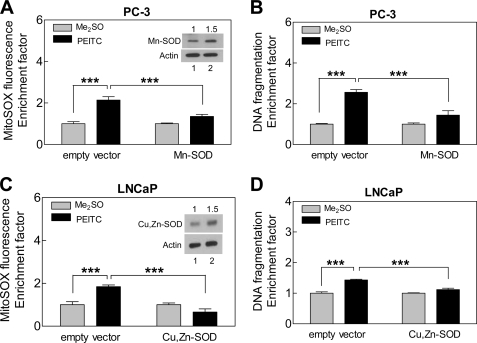
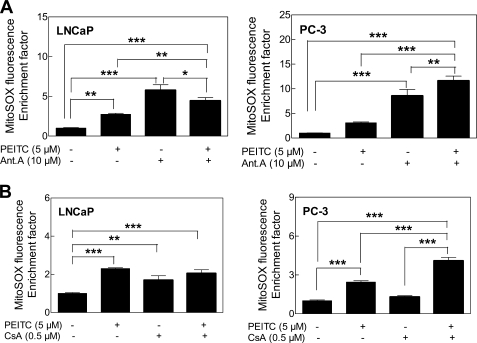
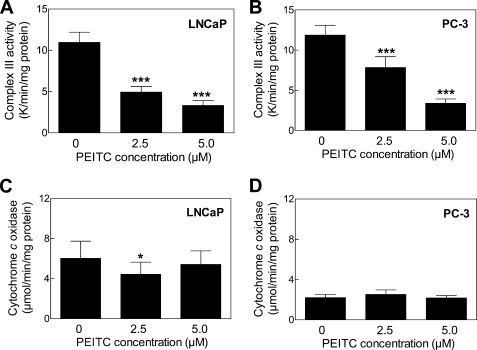
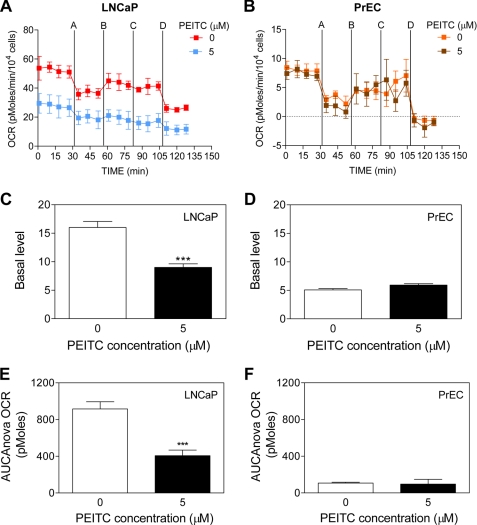
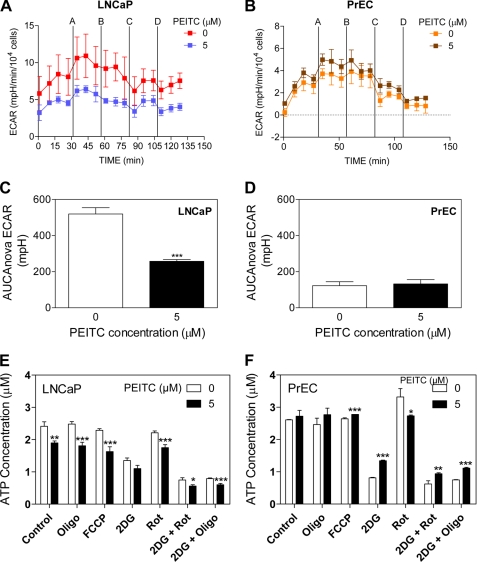
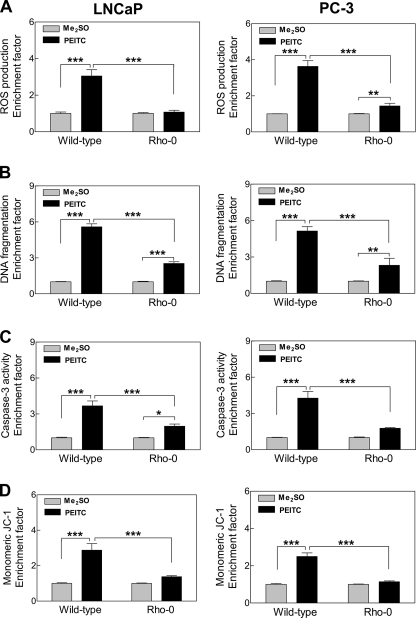
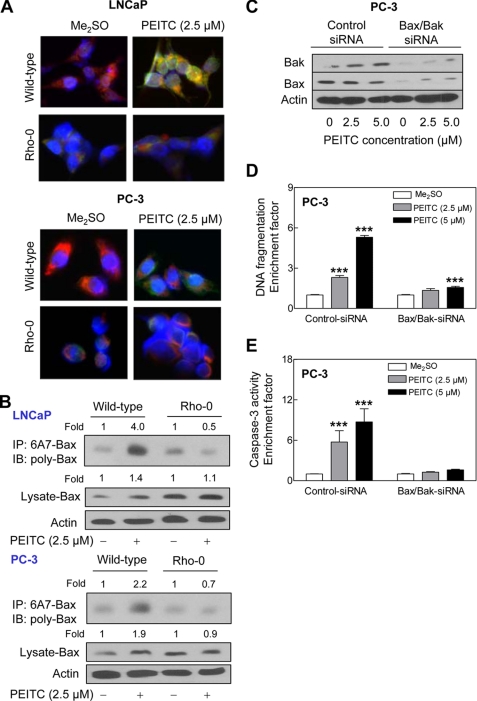
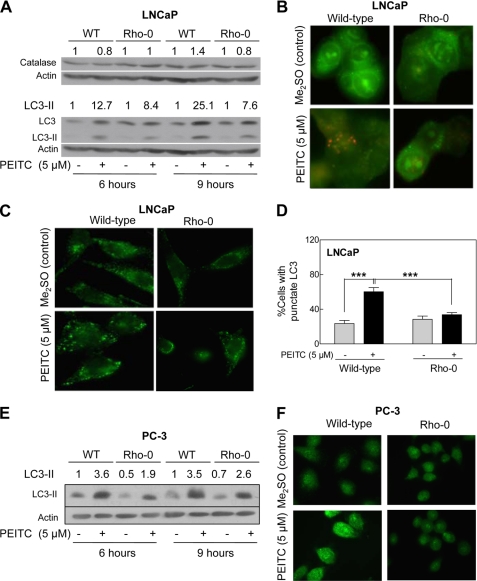
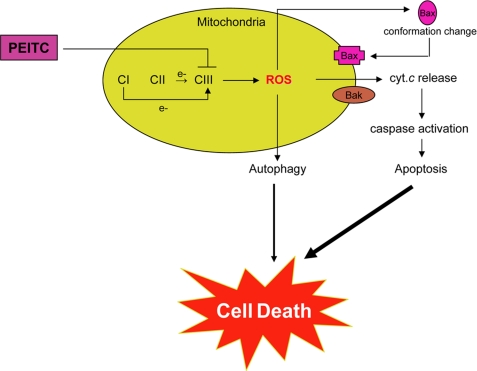
Phenethyl isothiocyanate (PEITC), a constituent of edible cruciferous vegetables such as watercress, not only affords significant protection against chemically induced cancer in experimental rodents but also inhibits growth of human cancer cells by causing apoptotic and autophagic cell death. However, the underlying mechanism of PEITC-induced cell death is not fully understood. Using LNCaP and PC-3 human prostate cancer cells as a model, we demonstrate that the PEITC-induced cell death is initiated by production of reactive oxygen species (ROS) resulting from inhibition of oxidative phosphorylation (OXPHOS). Exposure of LNCaP and PC-3 cells to pharmacologic concentrations of PEITC resulted in ROS production, which correlated with inhibition of complex III activity, suppression of OXPHOS, and ATP depletion. These effects were not observed in a representative normal human prostate epithelial cell line (PrEC). The ROS production by PEITC treatment was not influenced by cyclosporin A. The Rho-0 variants of LNCaP and PC-3 cells were more resistant to PEITC-mediated ROS generation, apoptotic DNA fragmentation, and collapse of mitochondrial membrane potential compared with respective wild-type cells. The PEITC treatment resulted in activation of Bax in wild-type LNCaP and PC-3 cells, but not in their respective Rho-0 variants. Furthermore, RNA interference of Bax and Bak conferred significant protection against PEITC-induced apoptosis. The Rho-0 variants of LNCaP and PC-3 cells also resisted PEITC-mediated autophagy. In conclusion, the present study provides novel insight into the molecular circuitry of PEITC-induced cell death involving ROS production due to inhibition of complex III and OXPHOS.


Figures

FIGURE 1.
FIGURE 1.
PEITC treatment caused ROS production in LNCaP and PC-3 human prostate cancer cells. A, flow cytometric measurement of MitoSOX Red fluorescence in LNCaP and PC-3 cells treated with Me2SO or 5 μm PEITC for the indicated times. Results shown are mean ± S.E. Total sample size is n = 6 per group. As described under “Statistical Methods,” S.E. bars are estimated from the mixed effects ANOVA. Significantly different (***, p < 0.001) compared with corresponding control by mixed effects ANOVA. B, confocal microscopy for MitoSOX Red and MitoTracker Green fluorescence in LNCaP cells treated with Me2SO or 2.5 μm PEITC for 4 h. C, representative EPR spectra depicting CM· signal in PC-3 and LNCaP cells following 6 h treatment with Me2SO or PEITC. Spectra represent five additive scans during the last 2 min (8–10 min). EPR experiments were repeated twice in duplicate in each cell line, and the results were consistent.
FIGURE 2.
FIGURE 2.
Effect of NAC on PEITC-mediated ROS generation and apoptosis. A, EPR spectra for CM· in PC-3 cells treated for 6 h with Me2SO or 5 μm PEITC without or with a 2-h pretreatment with 4 mm NAC. (NAC was present during the PEITC treatment.) B, quantification of spectral intensity, peak to trough, of the up-field signal (first peak on the left) of the CM· spectrum. Effect of pretreatment with NAC (2-h pretreatment) on PEITC-mediated MitoSOX Red fluorescence relative to control in PC-3 (C) and LNCaP cells (E), and on cytoplasmic histone-associated DNA fragmentation in PC-3 (D) and LNCaP cells (F). The cells were pretreated with 4 mm NAC for 2 h and then exposed to 5 μm PEITC for 6 h (C and E) or for 24 h (D and F) in the presence of NAC. Results shown are mean ± S.E. Total sample size is n = 4 for data in B and n = 6 for other panels. Significantly different (*, p < 0.05, **, p < 0.01, and ***, p < 0.001) between the indicated groups by mixed effects ANOVA.
FIGURE 3.
FIGURE 3.
SOD overexpression inhibited PEITC-mediated ROS generation and apoptosis. MitoSOX Red fluorescence (A and C) and cytoplasmic histone-associated DNA fragmentation (B and D) in cells transfected with empty vector or vector encoding for Mn-SOD or Cu,Zn-SOD. The cells were treated with Me2SO or 5 micromolar PEITC for 6 h for MitoSOX Red fluorescence assay and for 24 h for DNA fragmentation assay. Insets, immunoblotting for Mn-SOD in PC-3 cells (A) or Cu,Zn-SOD in LNCaP cells (C) in cells transfected with empty vector (lane 1) or vector encoding for the specified SOD (lane 2). Results shown are mean ± S.E. Total sample size is n = 6 per group. S.E. bars are estimated from the mixed effects ANOVA. Significantly different (***, p < 0.001) between the indicated groups by mixed effects ANOVA.
FIGURE 4.
FIGURE 4.
Effects of antimycin A (Ant. A) and cyclosporin A (CsA) on PEITC-mediated ROS generation. Effect of 1-h pretreatment with 10 μm antimycin A (A) or co-treatment with CsA (B) and PEITC on MitoSOX Red fluorescence in LNCaP and PC-3 cells. Results shown are mean ± S.E. Total sample size is n = 6–9 per group. As described under “Statistical Methods,” S.E. bars are estimated from the mixed effects ANOVA. Significantly different (*, p < 0.05, **, p < 0.01, and ***, p < 0.001) between the indicated groups by mixed effects ANOVA.
FIGURE 5.
FIGURE 5.
PEITC treatment inhibited complex III activity in LNCaP and PC-3 cells. Complex III activity in LNCaP (A) and PC-3 cells (B), and cytochrome c oxidase activity in LNCaP (C) and PC-3 cells (D) following 24 h of treatment with Me2SO or the indicated concentrations of PEITC. Results shown are mean ± S.E. Total sample size is n = 9 per group. As described under “Statistical Methods,” S.E. bars are estimated from the mixed effects ANOVA. Significantly different (*, p < 0.05 and ***, p < 0.001) compared with control by mixed effects ANOVA.
FIGURE 6.
FIGURE 6.
PEITC treatment inhibited OXPHOS in LNCaP cells. Pharmacologic profiling of OCR, indicative of OXPHOS in LNCaP (A) and PrEC cells (B) treated for 6 h with Me2SO or 5 μm PEITC through real-time measurements using the Seahorse Bioscience XF24 extracellular flux analyzer. After measurement of basal oxygen consumption (C and D), the cells were treated with a series of metabolic inhibitors, including oligomycin (injection A); FCCP (injection B); 2-DG (injection C); and rotenone (injection D) at the indicated times. Basal oxygen consumption was calculated using the difference between the mean of time points prior to injection A (squares 1–4) and prior to injection B (squares 5 to 7; oligomycin-sensitive) (1–45–7). Reserve respiration capacity area under the curve (AUC) for LNCaP (E) and PrEC cell lines (F) calculated using the time point (square 7) prior to injection B through the time point (square 13) just prior to injection D. Results are expressed as mean ± S.E. of five and four biological experiments performed in triplicate for LNCaP and PrEC, respectively. Significantly different (***, p < 0.001) compared with control by one-way ANOVA followed by Dunnett's test.
FIGURE 7.
FIGURE 7.
PEITC treatment decreased glycolysis and ATP levels in LNCaP cells. Pharmacologic profiling of ECAR in LNCaP (A) and PrEC cells (B) through real-time measurements using a Seahorse Bioscience XF24 extracellular flux analyzer following 6 h of treatment with Me2SO or 5 μm PEITC. After measurement of basal lactate production, the cells were treated with metabolic inhibitors as described in the legend to Fig. 6. Area under the curve (AUC) for total glycolysis activity in LNCaP cells (C) and PrEC cells (D) after inhibition of oxidative phosphorylation calculated using the time point just prior to injection A (square 4) until the second to last point (square 15). Results are expressed as mean ± S.E. of five and four biological experiments performed in triplicate for LNCaP and PrEC, respectively. Steady-state levels of ATP in LNCaP (E) and PrEC cells (F) treated with Me2SO or PEITC in the absence or presence of the metabolic inhibitors. Results shown are mean ± S.E. of four or two biological repeats performed in quadruplicate for LNCaP and PrEC cells, respectively. Significantly different (*, p < 0.05, **, p < 0.01, and ***, p < 0.001) compared with control by one-way ANOVA followed by Dunnett's test. Oligo, oligomycin; Rot, rotenone.
FIGURE 8.
FIGURE 8.
Rho-0 variants of LNCaP and PC-3 cells were resistant to apoptosis induction by PEITC. A, ROS production; B, DNA fragmentation; C, caspase-3 activation; and D, monomeric JC-1 associated green fluorescence (a measure of mitochondrial membrane potential collapse) in wild-type LNCaP and PC-3 cells and their respective Rho-0 variants following a 4-h treatment (A and D) or 24-h treatment (B and C) with Me2SO or 5 μm PEITC. Results shown are mean ± S.E. Total sample size is n = 6 per group. As described under “Statistical Methods,” S.E. bars are estimated from the mixed effects ANOVA (*, p < 0.05, **, p < 0.01, and ***, p < 0.001).
FIGURE 9.
FIGURE 9.
ROS-dependent Bax activation in PEITC-induced apoptosis. A, immunocytochemical staining for Bax (green fluorescence), mitochondria (MitoTracker Red-associated red fluorescence), and nuclei (blue fluorescence) in wild-type and Rho-0 LNCaP and PC-3 cells following an 8-h treatment with Me2SO (control) or 2.5 μm PEITC. B, analysis of conformational change of Bax using lysates from wild-type LNCaP and PC-3 cells and their Rho-0 variants following an 8-h treatment with Me2SO or 2.5 μm PEITC. Active Bax with conformational change was immunoprecipitated (IP) from equal amounts of lysate proteins using anti-Bax 6A7 monoclonal antibody and immunoprecipitates were subjected to immunoblotting (IB) using polyclonal anti-Bax antibody. Immunoblotting for total Bax protein also was performed using cell lysate. Immunoblotting for Bax and Bak (C), cytoplasmic histone-associated DNA fragmentation (D), and caspase-3 activation (E) in PC-3 cells transiently transfected with a control nonspecific siRNA or combined Bax and Bak-targeted siRNA and treated for 24 h with Me2SO or the indicated concentrations of PEITC. Results shown are mean ± S.E. Total sample size is n = 6 per group. As described under “Statistical Methods,” S.E. bars are estimated from the mixed effects ANOVA. Significantly different (***, p < 0.001) compared with corresponding Me2SO-treated control by mixed effects ANOVA.
FIGURE 10.
FIGURE 10.
Role of ROS in PEITC-induced autophagy. A, immunoblotting for catalase and LC3 using lysates from wild-type LNCaP cells and its Rho-0 variant following a 6- or 9-h treatment with Me2SO or 5 μm PEITC. B, analysis of acidic vesicular organelles (yellow-orange) in wild-type LNCaP cells and its Rho-0 variant following a 9-h treatment with Me2SO or 5 μm PEITC (×100 objective magnification). C, immunofluorescence microscopic analysis for punctate pattern of LC3 localization in wild-type LNCaP cells and its Rho-0 variant following 9 h of treatment with Me2SO or 5 μm PEITC (×100 objective magnification). D, percentage of cells with punctate pattern of LC3 localization in wild-type LNCaP and its Rho-0 variant following a 9-h treatment with Me2SO or 5 μm PEITC. Results shown are mean ± S.E. Total sample size is n = 4–5 per group. S.E. bars are estimated from the mixed effects ANOVA. Significantly different (***, p < 0.001) between the indicated groups by mixed effects ANOVA. E, immunoblotting for cleaved LC3-II using lysates from wild-type (WT) PC-3 cells and its Rho-0 variant following a 6- or 9-h treatment with Me2SO or 5 μm PEITC. F, immunofluorescence microscopic analysis for LC3 localization in wild-type PC-3 cells and its Rho-0 variant following 9 h of treatment with Me2SO or 5 μm PEITC (×100 objective magnification).
FIGURE 11.
FIGURE 11.
Schematic presentation of a mechanistic model explaining PEITC-induced cell death in human prostate cancer cells, involving inhibition of complex III activity leading to ROS production, Bax activation, collapse of mitochondrial membrane potential, caspase-3 activation and eventual cell death. The PEITC-induced autophagic death is also partly dependent on ROS production, but the precise mechanism by which ROS regulate autophagy induction remains to be elucidated. CI, complex I; cyt. c, cytochrome c.

Similar articles

Cited by

References

    1. Jemal A., Siegel R., Ward E., Murray T., Xu J., Thun M. J. (2007) CA Cancer J. Clin. 57, 43–66 - PubMed
    1. Verhoeven D. T., Goldbohm R. A., van Poppel G., Verhagen H., van den Brandt P. A. (1996) Cancer Epidemiol. Biomarkers Prev. 5, 733–748 - PubMed
    1. Kolonel L. N., Hankin J. H., Whittemore A. S., Wu A. H., Gallagher R. P., Wilkens L. R., John E. M., Howe G. R., Dreon D. M., West D. W., Paffenbarger R. S., Jr. (2000) Cancer Epidemiol. Biomarkers Prev. 9, 795–804 - PubMed
    1. Ambrosone C. B., McCann S. E., Freudenheim J. L., Marshall J. R., Zhang Y., Shields P. G. (2004) J. Nutr. 134, 1134–1138 - PubMed
    1. Hecht S. S. (2000) Drug Metab. Rev. 32, 395–411 - PubMed

Publication types

MeSH terms