

NHE3 mobility in brush borders increases upon NHERF2-dependent stimulation by lyophosphatidic acid
- PMID: 20571054
- PMCID: PMC2936692
- DOI: 10.1242/jcs.056713
NHE3 mobility in brush borders increases upon NHERF2-dependent stimulation by lyophosphatidic acid
Abstract
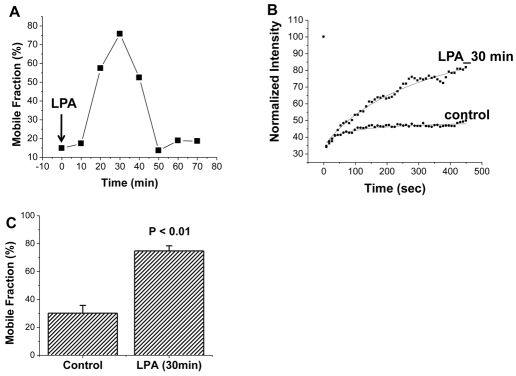
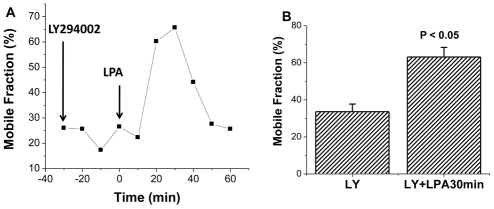
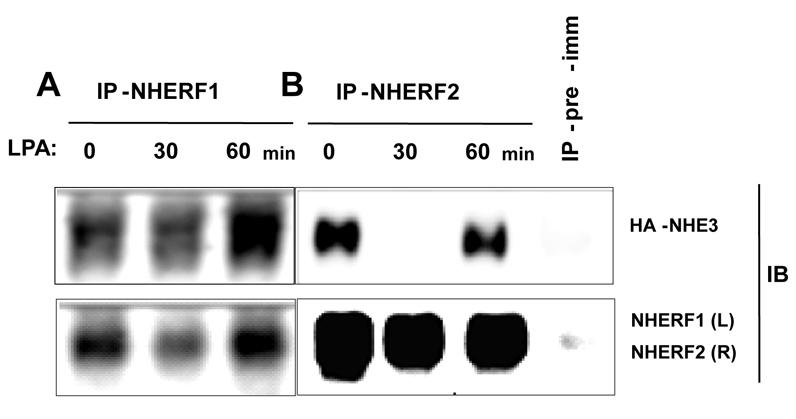
The epithelial brush border (BB) Na(+)/H(+) exchanger NHE3 is associated with the actin cytoskeleton by binding both directly and indirectly to ezrin; indirect binding is via attachment to NHERF family proteins. NHE3 mobility in polarized epithelial cell BBs is restricted by the actin cytoskeleton and NHERF binding such that only approximately 30% of NHE3 in the apical domain of an OK cell line stably expressing NHERF2 is mobile, as judged by FRAP analysis. Given that levels of NHE3 are partially regulated by changes in trafficking, we investigated whether the cytoskeleton association of NHE3 was dynamic and changed as part of acute regulation to allow NHE3 trafficking. The agonist studied was lysophosphatidic acid (LPA), an inflammatory mediator, which acutely stimulates NHE3 activity by increasing the amount of NHE3 on the BBs by stimulated exocytosis. LPA acutely stimulated NHE3 activity in OK cells stably expressing NHERF2. Two conditions that totally prevented LPA stimulation of NHE3 activity only partially prevented stimulation of NHE3 mobility: the phosphoinositide 3-kinase (PI3K) inhibitor LY294002, and the NHE3F1 double mutant which has minimal direct binding of NHE3 to ezrin. These results show that LPA stimulation of NHE3 mobility occurs in two parts: (1) PI3K-dependent exocytic trafficking to the BB and (2) an increase in surface mobility of NHE3 in BBs under basal conditions. Moreover, the LPA stimulatory effect on NHE3 mobility required NHERF2. Although NHE3 and NHERF2 co-precipitated under basal conditions, they failed to co-precipitate 30 minutes after addition of LPA, whereas the physical association was re-established by 50-60 minutes. This dynamic interaction between NHERF2 and NHE3 was confirmed by acceptor photobleaching Förster Resonance energy Transfer (FRET). The restricted mobility of NHE3 in BBs under basal conditions as a result of cytoskeleton association is therefore dynamic and is reversed as part of acute LPA stimulation of NHE3. We suggest that this acute but transient increase in NHE3 mobility induced by LPA occurs via two processes: addition of NHE3 to the BB by exocytosis, a process which precedes binding of NHE3 to the actin cytoskeleton via NHERF2-ezrin, and by release of NHERF2 from the NHE3 already localized in the apical membrane, enabling NHE3 to distribute throughout the microvilli. These fractions of NHE3 make up a newly identified pool of NHE3 called the 'transit pool'. Moreover, our results show that there are two aspects of LPA signaling involved in stimulation of NHE3 activity: PI3K-dependent stimulated NHE3 exocytosis and the newly described, PI3K-independent dissociation of microvillar NHE3 from NHERF2.
Figures


Similar articles
-
Lysophosphatidic acid stimulation of NHE3 exocytosis in polarized epithelial cells occurs with release from NHERF2 via ERK-PLC-PKCδ signaling.Am J Physiol Cell Physiol. 2014 Jul 1;307(1):C55-65. doi: 10.1152/ajpcell.00045.2014. Epub 2014 Apr 23. Am J Physiol Cell Physiol. 2014. PMID: 24760985 Free PMC article.
-
Both NHERF3 and NHERF2 are necessary for multiple aspects of acute regulation of NHE3 by elevated Ca2+, cGMP, and lysophosphatidic acid.Am J Physiol Gastrointest Liver Physiol. 2018 Jan 1;314(1):G81-G90. doi: 10.1152/ajpgi.00140.2017. Epub 2017 Sep 7. Am J Physiol Gastrointest Liver Physiol. 2018. PMID: 28882822 Free PMC article.
-
Elevated calcium acutely regulates dynamic interactions of NHERF2 and NHE3 proteins in opossum kidney (OK) cell microvilli.J Biol Chem. 2011 Oct 7;286(40):34486-96. doi: 10.1074/jbc.M111.230219. Epub 2011 Jul 28. J Biol Chem. 2011. PMID: 21799002 Free PMC article.
-
The epithelial brush border Na+/H+ exchanger NHE3 associates with the actin cytoskeleton by binding to ezrin directly and via PDZ domain-containing Na+/H+ exchanger regulatory factor (NHERF) proteins.Clin Exp Pharmacol Physiol. 2008 Aug;35(8):863-71. doi: 10.1111/j.1440-1681.2008.04931.x. Epub 2008 Apr 21. Clin Exp Pharmacol Physiol. 2008. PMID: 18430067 Review.
-
NHE3 regulatory complexes.J Exp Biol. 2009 Jun;212(Pt 11):1638-46. doi: 10.1242/jeb.028605. J Exp Biol. 2009. PMID: 19448074 Free PMC article. Review.
Cited by
-
PLC-γ directly binds activated c-Src, which is necessary for carbachol-mediated inhibition of NHE3 activity in Caco-2/BBe cells.Am J Physiol Cell Physiol. 2013 Aug 1;305(3):C266-75. doi: 10.1152/ajpcell.00277.2012. Epub 2013 May 22. Am J Physiol Cell Physiol. 2013. PMID: 23703528 Free PMC article.
-
The recycling regulation of sodium-hydrogen exchanger isoform 3(NHE3) in epithelial cells.Cell Cycle. 2021 Dec;20(24):2565-2582. doi: 10.1080/15384101.2021.2005274. Epub 2021 Nov 25. Cell Cycle. 2021. PMID: 34822321 Free PMC article. Review.
-
Myosin VI mediates the movement of NHE3 down the microvillus in intestinal epithelial cells.J Cell Sci. 2014 Aug 15;127(Pt 16):3535-45. doi: 10.1242/jcs.149930. Epub 2014 Jun 13. J Cell Sci. 2014. PMID: 24928903 Free PMC article.
-
D-glucose acts via sodium/glucose cotransporter 1 to increase NHE3 in mouse jejunal brush border by a Na+/H+ exchange regulatory factor 2-dependent process.Gastroenterology. 2011 Feb;140(2):560-71. doi: 10.1053/j.gastro.2010.10.042. Epub 2010 Oct 23. Gastroenterology. 2011. PMID: 20977906 Free PMC article.
-
EGFR as a Negative Regulatory Protein Adjusts the Activity and Mobility of NHE3 in the Cell Membrane of IPEC-J2 Cells With TGEV Infection.Front Microbiol. 2018 Nov 13;9:2734. doi: 10.3389/fmicb.2018.02734. eCollection 2018. Front Microbiol. 2018. PMID: 30483239 Free PMC article.
References
-
- Akhter S., Kovbasnjuk O., Li X., Cavet M., Noel J., Arpin M., Hubbard A. L., Donowitz M. (2002). Na(+)/H(+) exchanger 3 is in large complexes in the center of the apical surface of proximal tubule-derived OK cells. Am. J. Physiol. Cell Physiol. 283, C927-C940 - PubMed
-
- Alexander R. T., Grinstein S. (2006). Na+/H+ exchangers and the regulation of volume. Acta Physiol. (Oxf) 187, 159-167 - PubMed
-
- Alexander R. T., Malevanets A., Durkan A. M., Kocinsky H. S., Aronson P. S., Orlowski J., Grinstein S. (2007). Membrane curvature alters the activation kinetics of the epithelial Na+/H+ exchanger, NHE3. J. Biol. Chem. 282, 7376-7384 - PubMed
Publication types
MeSH terms
Substances
Grants and funding
- R24 DK064388/DK/NIDDK NIH HHS/United States
- R01 DK026523/DK/NIDDK NIH HHS/United States
- R01 GM 073846/GM/NIGMS NIH HHS/United States
- R01 GM073846/GM/NIGMS NIH HHS/United States
- P01 DK072084/DK/NIDDK NIH HHS/United States
- T32DK2007632/DK/NIDDK NIH HHS/United States
- R01DK61765/DK/NIDDK NIH HHS/United States
- R01 DK061765/DK/NIDDK NIH HHS/United States
- K01 DK080930/DK/NIDDK NIH HHS/United States
- K01DK080930/DK/NIDDK NIH HHS/United States
- R24DK64388/DK/NIDDK NIH HHS/United States
- P01DK072084/DK/NIDDK NIH HHS/United States
- R01DK26523/DK/NIDDK NIH HHS/United States
LinkOut - more resources
Full Text Sources
Miscellaneous
