. 2010 Aug 4;29(15):2586-97.
doi: 10.1038/emboj.2010.136. Epub 2010 Jun 22.

Overlapping functions of Hdac1 and Hdac2 in cell cycle regulation and haematopoiesis

Affiliations

Overlapping functions of Hdac1 and Hdac2 in cell cycle regulation and haematopoiesis

Roel H Wilting et al. EMBO J. .

Abstract

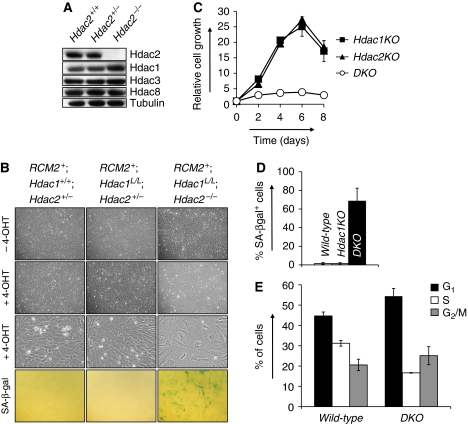
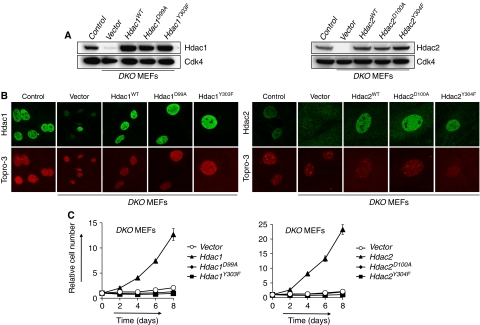
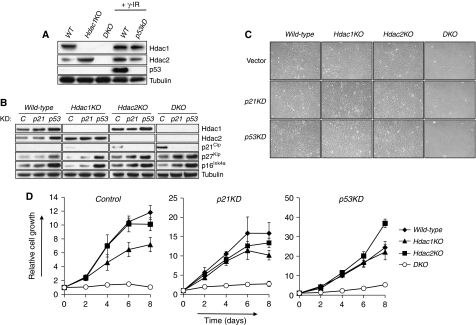
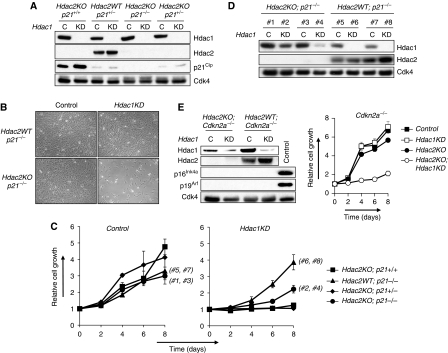
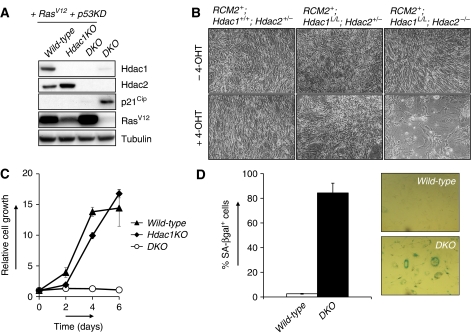
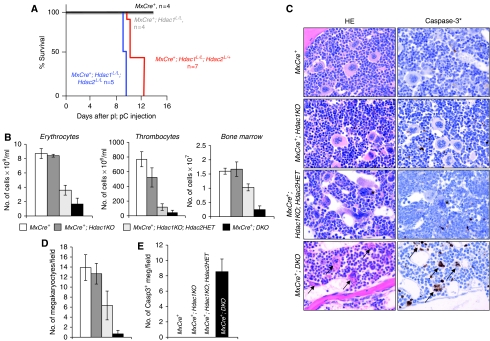
Histone deacetylases (HDACs) counterbalance acetylation of lysine residues, a protein modification involved in numerous biological processes. Here, Hdac1 and Hdac2 conditional knock-out alleles were used to study the function of class I Hdac1 and Hdac2 in cell cycle progression and haematopoietic differentiation. Combined deletion of Hdac1 and Hdac2, or inactivation of their deacetylase activity in primary or oncogenic-transformed fibroblasts, results in a senescence-like G(1) cell cycle arrest, accompanied by up-regulation of the cyclin-dependent kinase inhibitor p21(Cip). Notably, concomitant genetic inactivation of p53 or p21(Cip) indicates that Hdac1 and Hdac2 regulate p53-p21(Cip)-independent pathways critical for maintaining cell cycle progression. In vivo, we show that Hdac1 and Hdac2 are not essential for liver homeostasis. In contrast, total levels of Hdac1 and Hdac2 in the haematopoietic system are critical for erythrocyte-megakaryocyte differentiation. Dual inactivation of Hdac1 and Hdac2 results in apoptosis of megakaryocytes and thrombocytopenia. Together, these data indicate that Hdac1 and Hdac2 have overlapping functions in cell cycle regulation and haematopoiesis. In addition, this work provides insights into mechanism-based toxicities observed in patients treated with HDAC inhibitors.


Conflict of interest statement

The authors declare that they have no conflict of interest.

Figures

Figure 1
Figure 1
Hdac1 and Hdac2 collectively control cell cycle progression. (A) Western blot analysis of Hdac2-deficient MEF protein lysates for indicated proteins. Tubulin served as a loading control. (B) Representative photographs of MEF cell cultures with indicated genotypes grown without 4-OHT or with 200 nM 4-OHT. Representative details of MEF cultures with indicated genotypes are shown in the third row. Note the presence of large, flat cells in 4-OHT-treated RCM2+;Hdac1L/L;Hdac2−/− cultures. Bottom panels show representative pictures of senescence-associated β-galactosidase-stained MEF cultures with indicated genotypes. (C) Growth curve analysis of Hdac1KO (closed squares), Hdac2KO (closed triangles) or DKO MEFs (open circles). All experiments were performed in triplicate. (D) Percentage of SA-bgalactosidase positive cells in MEF cultures with indicated genotypes. (E) Cell cycle analysis of wild-type and DKO MEFs for G1, S and G2/M cell cycle phases by BrdU-PI FACS. Values represent the average of three independent experiments.
Figure 2
Figure 2
Hdac1 or Hdac2 deacetylase activity is required for cell cycle progression. (A) Western blot analysis of DKO MEFs expressing wild-type Hdac1, Hdac1D99A, Hdac1Y303F (left panel), wild-type Hdac2, Hdac2D100A or Hdac2Y304F (right panel). Lysates prepared from wild-type (control) and DKO MEFs (vector) were used as a positive and negative control, respectively. Cdk4 served as a loading control. (B) Subcellular localization of wild-type and mutant Hdac1 and Hdac2 ectopically expressed in DKO MEFs by immunofluorescence staining using antibodies for Hdac1 (left panels) or Hdac2 (right panels). Note the presence of a Hdac1-proficient nucleus in vector-treated DKO MEFs because of a non-recombined Hdac1 cKO allele. (C) Growth curve analysis of DKO MEFs expressing either wild-type or mutant Hdac1 or Hdac2.
Figure 3
Figure 3
Hdac1 and Hdac2 regulate cell cycle progression independent of p53 or p21Cip. (A) Western blot analysis of wild-type (WT), Hdac1KO and DKO MEF protein lysates for Hdac1, Hdac2 and p53. γ-Irradiated wild-type cells expressing either control or p53 shRNA were used as a positive and negative control, respectively. Tubulin served as a loading control. (B) Western blot analysis of protein lysates for Hdac1, Hdac2, p21Cip, p27Kip and p16Ink4a of MEFs with indicated genotypes infected with retroviruses expressing control shRNA (C), p21Cip shRNA (p21) or p53 shRNA (p53). Tubulin served as a loading control. (C) Representative pictures of wild-type, Hdac1KO, Hdac2KO or DKO MEFs infected with retroviruses expressing control shRNA, p21Cip shRNA or p53 shRNA. (D) Growth curve analysis of wild-type, Hdac1KO, Hdac2KO and DKO MEFs, expressing either control shRNA or shRNA directed against p21Cip and p53.
Figure 4
Figure 4
Genetic ablation of p21Cip, p16Ink4a or p19Arf does not allow proliferation of DKO MEFs. (A) Western blot analysis of protein lysates of indicated MEFs expressing either control shRNA (C) or Hdac1 shRNA (KD) for Hdac1, Hdac2 and p21Cip. Cdk4 served as a loading control. (B) Representative pictures of MEFs with indicated genotypes infected with retroviruses expressing either control shRNA or Hdac1 shRNA. (C) Growth curve analysis of Hdac2KO;p21+/+(squares), Hdac2WT;p21−/− (triangles), Hdac2KO;p21+/− (diamonds) and Hdac2KO;p21−/− (circles), MEFs expressing either control shRNA (left panel) or Hdac1 shRNA (right panel). (D) Western blot analysis of protein lysates for Hdac1 and Hdac2 of two independent Hdac2WT;p21−/− and Hdac2KO;p21−/− MEF clones infected with either control (#1, #3, #5, #7) or Hdac1 shRNA (#2, #4, #6, #8), isolated at day 8 of the growth curve analysis as shown in (C). The clone numbers in (C) correspond with the clones and genotypes as shown in (D). Cdk4 served as a loading control. (E) Left panel: western blot analysis of Hdac2WT;Cdkn2a−/− and Hdac2KO;Cdkn2a−/− MEFs expressing either control (control) or Hdac1 shRNA (Hdac1KD) for Hdac1, Hdac2, p16Ink4a and p19Arf. Cdk4 was used as a loading control. As a control for p16Ink4a and p19Arf expression, we used late passage wild-type MEFs. Right panel: growth curve analysis of Hdac2WT;Cdkn2a−/− (squares) and Hdac2KO;Cdkn2a−/− (circles) MEFs expressing either control (filled tags) or Hdac1 shRNA (open tags).
Figure 5
Figure 5
Hdac1 and Hdac2 collectively suppress a senescence-inducing pathway in transformed cells. (A) Western blot analysis of 4-OHT-treated MEFs with indicated genotypes, expressing RasV12 and p53 shRNA for Hdac1, Hdac2, p21Cip and RasV12. Tubulin served as loading control. DKO MEFs served as a control for p21Cip expression. (B) Representative pictures of oncogenic-transformed (RasV12;p53KD) MEF cultures with indicated genotypes in the absence (top panels) or presence (lower panels) of 4-OHT. (C) Growth curve analysis of wild-type (triangles), Hdac1KO (diamonds) and DKO (open circles) oncogenic-transformed MEFs. (D) Quantification and representative pictures of SA-β-galactosidase positive cells in cultures of wild-type and DKO oncogenic-transformed cells. Shown are average values of six different microscopic fields.
Figure 6
Figure 6
Hdac1 and Hdac2 have overlapping functions in haematopoiesis. (A) Kaplan–Meier curves of pI;pC-treated MxCre+, MxCre+;Hdac1L/L, MxCre+Hdac1L/L;Hdac2L/+ and MxCre+Hdac1L/L;Hdac2L/L mice. (B) Total bone marrow (per femur), erythrocyte and thrombocyte numbers in peripheral blood of mice with indicated genotypes. (C) Bone marrow histology of pI;pC-treated MxCre+, MxCre+;Hdac1KO, MxCre+;Hdac1KO;Hdac2HET and MxCre+;DKO mice; left panels show haematoxylin–eosin-stained paraffin tissue sections, right panels show immunohistochemistry on paraffin tissue sections using antibodies against activated caspase-3. Note the presence of mitotic figures (asterix) in megakaryocytes of MxCre+;Hdac1KO;Hdac2HET mice. Magnification is × 200. (D) Average megakaryocyte number in bone marrow in six different microscopic fields of three independent mice with indicated genotype. (E) Quantification of activated caspase-3 positive cells in bone marrow of indicated pI;pC-treated genotypes. Shown are average counts in three different microscopic fields in three independent mice per genotype.

Similar articles

Cited by

References

    1. Archer SY, Meng S, Shei A, Hodin RA (1998) p21(WAF1) is required for butyrate-mediated growth inhibition of human colon cancer cells. Proc Natl Acad Sci USA 95: 6791–6796 - PMC - PubMed
    1. Bhaskara S, Chyla BJ, Amann JM, Knutson SK, Cortez D, Sun ZW, Hiebert SW (2008) Deletion of histone deacetylase 3 reveals critical roles in S phase progression and DNA damage control. Mol Cell 30: 61–72 - PMC - PubMed
    1. Brand M, Ranish JA, Kummer NT, Hamilton J, Igarashi K, Francastel C, Chi TH, Crabtree GR, Aebersold R, Groudine M (2004) Dynamic changes in transcription factor complexes during erythroid differentiation revealed by quantitative proteomics. Nat Struct Mol Biol 11: 73–80 - PubMed
    1. Brummelkamp TR, Bernards R, Agami R (2002) Stable suppression of tumorigenicity by virus-mediated RNA interference. Cancer Cell 2: 243–247 - PubMed
    1. Campisi J (2005) Senescent cells, tumor suppression, and organismal aging: good citizens, bad neighbors. Cell 120: 513–522 - PubMed

Publication types

MeSH terms