. 2010 Jun 22:6:382.
doi: 10.1038/msb.2010.37.

A modular gradient-sensing network for chemotaxis in Escherichia coli revealed by responses to time-varying stimuli

Affiliations

A modular gradient-sensing network for chemotaxis in Escherichia coli revealed by responses to time-varying stimuli

Thomas S Shimizu et al. Mol Syst Biol. .

Abstract

The Escherichia coli chemotaxis-signaling pathway computes time derivatives of chemoeffector concentrations. This network features modules for signal reception/amplification and robust adaptation, with sensing of chemoeffector gradients determined by the way in which these modules are coupled in vivo. We characterized these modules and their coupling by using fluorescence resonance energy transfer to measure intracellular responses to time-varying stimuli. Receptor sensitivity was characterized by step stimuli, the gradient sensitivity by exponential ramp stimuli, and the frequency response by exponential sine-wave stimuli. Analysis of these data revealed the structure of the feedback transfer function linking the amplification and adaptation modules. Feedback near steady state was found to be weak, consistent with strong fluctuations and slow recovery from small perturbations. Gradient sensitivity and frequency response both depended strongly on temperature. We found that time derivatives can be computed by the chemotaxis system for input frequencies below 0.006 Hz at 22 degrees C and below 0.018 Hz at 32 degrees C. Our results show how dynamic input-output measurements, time honored in physiology, can serve as powerful tools in deciphering cell-signaling mechanisms.


Conflict of interest statement

The authors declare that they have no conflict of interest.

Figures

Figure 1
Figure 1
A modular gradient-sensing network. (A) Molecular view of the chemotaxis network. The linear path from input to output begins with the input ligand concentration, [L], being sensed by the membrane-associated receptor–kinase complex, A, to regulate its autophosphorylation-activity, a. A then transfers phosphate to the response regulator, CheY (Y), the phosphorylated form of which (Y-P) interacts with the flagellar motor (M), to control swimming behavior. The feedback loop is closed by the methyltransferase CheR (R) and the methylesterase/deamidase CheB (B), by regulation of the receptor methylation level, m. CheZ (Z), the phosphatase for CheY-P, decreases the signal lifetime, thus accelerating the response of the pathway. (B) Modular view of the network. Focusing on the functional modules, rather than the variables, of the network yields this block diagram, in which the variables are viewed as inputs or outputs (represented along wires) of two discrete signal processing modules (represented as boxes). The input–output relation of the receptor module is described by the function G, which takes [L] and m as inputs to produce an output a, which connects to the downstream linear pathway toward motor output. The adaptation module constitutes the feedback loop of the network, in which the output a is converted through F(a) to dm/dt and integrated over time.
Figure 2
Figure 2
Temporal profiles of pathway activity during exponential ramps. FRET responses (gray points) were observed during stimulation by exponential ramps in concentration of the form [L](t)=[L]0ert of the attractant MeAsp (blue curves). Responses were quantified by fitted functions to the FRET response (red curves). For both ramps up (r>0; A, C, E, G) or down (r<0; B, D, F, H), the FRET readout reached a steady level after an initial transient, which was well fit by a single-exponential decay. The change in the level of FRET could be converted to units of kinase activity, Δa (see text), which was negative for up ramps, and positive for down ramps, as expected. The traces in the panels here were responses to ramp rates r=±0.001 (A, B), r=±0.005 (C, D), r=±0.01 (E, F), and r=±0.02 (G, H). The gray points in each panel are aligned averages of two to three separately measured responses to identical stimuli. Source data is available for this figure at www.nature.com/msb.
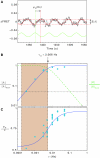
Figure 3
Figure 3
Gradient sensitivity and the feedback transfer function F(a). (A) By measuring exponential ramp responses in the manner of Figure 2A–H over a range of ramp rates r, we constructed a gradient-sensitivity curve, relating the kinase-activity a, to the steepness of the temporal gradient experienced by cells. The results for two FRET strains considered wild type for chemotaxis (VS104, an RP437 derivative, cyan circles; TSS178, an AW405 derivative, dark blue squares) were essentially identical, and collapsed on to a sigmoidal curve with a steep region near r=0 (slope of fitted line, Δar≈−30 s). The steady-state activity in the absence of stimuli (i.e. at r=0) was found to be a0≈1/3. The inset in (A) is an expanded view about the point (r=0, a=a0), showing the absence of thresholds, at least down to r=±0.001 s−1. (B) Using our model, the data of (A) can be used to map the feedback transfer function F(a). The steady-state relation rF(ac) implies that we can rescale the r axis by the constant factor α, obtained from our calibration of the receptor-module transfer function G, and invert the axes about (r=0, a=a0) to obtain F(a). The shallow slope near this origin, F ′(a0)≈−0.01, implies weak negative feedback. The blue curve is a fit of a Michaelis–Menten reaction scheme formula image; see text for interpretation of parameters. Source data is available for this figure at www.nature.com/msb.
Figure 4
Figure 4
Frequency response and the bandwidth for derivative computations. FRET responses (gray dots) during stimulation by exponential sinusoids of the form formula image (A) with a frequency ν equal to that of the applied stimulus (green line), and the fit by a sinusoid (red line) of the form a(t)=a0+∣A∣cos(2πνt−φD), where ∣A∣ is the amplitude of the response and φD is the phase delay. When the amplitude (B) and phase (C) of responses are plotted against the driving frequency ν, the data are in excellent agreement with the analytical solutions of our model (equations (13) and (14)), plotted here without any free-fitting parameters—the solution uses parameters obtained separately from the ramp-response experiments of Figure 2 and 3 and MWC-model parameters obtained separately in dose–response experiments using step stimuli. These analytical solutions define the characteristic frequency of the response νm≈0.006 Hz, below which the network is able to compute time derivatives. The dashed green curve in (B) is the derivative-filtering function ∣H∣ obtained by factoring the solution of our linearized model (equation (15)). The characteristic frequency, νm determines the upper boundary of the frequency band over which time derivatives can be computed (shaded region). Presumably, the lower boundary would be determined by a noise floor, which in this figure is taken arbitrarily to be where the response amplitude (black curve in B) falls below 5% of maximum. Source data is available for this figure at www.nature.com/msb.
Figure 5
Figure 5
Effects of temperature on sensitivity to gradients and frequency response. (A) Sensitivity to gradients was markedly decreased at 32°C (red triangles; strain TSS178), in which the steady-state activity a0≈1/2. For comparison, the data at 22°C (same as Figure 3A) also are plotted (cyan circles; strains VS104 and TSS178). The slope of the linear fit to the 32°C points near a0 (red curve) was Δar≈−11 s. (B) The map of F(a) obtained by conversion of the data in (A) has a similar shape as that at 22°C, but the slope at the zero crossing, F ′(a0)≈−0.03, is approximately threefold steeper, implying stronger negative feedback. The red curve is a fit to the same Michaelis–Menten model as in Figure 3B (see text for parameter values and interpretation). (C) The frequency response is also shifted at 32°C (red triangles). The characteristic cutoff frequency νm≈0.018, obtained from the model fit (black curve), is approximately threefold higher than that at 22°C. For comparison, the 22°C data and the corresponding model prediction from Figure 4A also are reproduced here (cyan circles and blue curve). Source data is available for this figure at www.nature.com/msb.
Figure 6
Figure 6
Transient responses to ramps: the time required for derivative computations. (A) Schematic illustration of the changes in activity and free energies during exponential ramps. As the receptor–kinase activity approaches the constant value ac during exponential ramps, the rate of change of ligand- and methylation-dependent free energies (fL and fm, respectively) balance one another, leading to the asymptotic relation rF(ac) between the exponential ramp rate r and the net rate of change in intracellular methylation F(a) (see also Materials and methods). The time required for fm(t) to change by an amount equal to the total free-energy change Δf(ac) can be estimated as t1≈Δf(ac)/Nr, and provides a robust estimate for the time required for the activity a(t) to reach ac (see text). (B) A plot of rt1 versus Δf(ac) for exponential ramp responses at 22°C. The slope of the fitted curve yields an estimate for the extent of receptor cooperativity, N≈4.9, which is in good agreement with the value of N=6 obtained independently from dose–response curves from experiments using step stimuli (see text).
Figure 7
Figure 7
Calibration of the receptor-module transfer function, G([L],m). (A) FRET responses in kinase activity (points) to step stimuli of the attractant MeAsp were measured in a series of mutants in which the modification state of Tar receptors were fixed by deletions of the cheR and cheB genes. To reveal the response of the Tar receptor, these measurements were conducted in a genetic background in which Tsr and Tap receptors are not expressed. Fits to the allosteric MWC model (equations (6), (7) and (8)), with parameters N=6, KI/KA=0.0062 are shown as solid lines. The gray level of the points and solid curves indicate the modification state of the mutant strain, and is tabulated in the legend (lighter shades of gray for higher modification levels). The blue points and curve, denoted wt in this figure, is the strain VS178, which has the same receptor complement as the other mutants (Tsr−Tap−), but retains the wild-type genes for CheR and CheB. Kinase activity is shown normalized to the pre-stimulus value for the strain VS104. (B) Values of fm, obtained for each modification state represented in (A), plotted against the number of modified sites. The data for modification states containing only glutamate (E) and glutamine (Q) residues (black points) fell on a straight line (dotted) when plotted as a function of the number of E → Q transitions (nE → Q; black points). The data for modification states containing only Q's and methylated glutamates (Em) fell on a different straight line (dashed), when plotted as a function of the number of Q → Em transitions (nQ → Em; magenta points). The values for the two extreme methylation levels, EEEE (corresponding to m=0) and EmEmEmEm (corresponding to m=4), were obtained by extrapolation of the two straight lines, as they could not be obtained directly from fits to the FRET data (cells with the Tar population fixed in this state did not respond to any concentration of MeAsp, as is seen in (A)). The solid line connecting these two extreme states reveals the dependence of fm on the E → Em transitions (nE → Em; gray points), and the CheR+CheB+ strain VS178 (blue point, denoted wt) falls on this line, as expected. When fitted by equation (9), this line yields the parameters m0≈0.5 and α≈2 kT used throughout this study. Source data is available for this figure at www.nature.com/msb.
Figure 8
Figure 8
Chemical waveform generator: design and performance. (A) The chemical waveform generator, based on the design of Block et al (1983). A mixing chamber of volume Vmix was fed two inputs: attractant at a high concentration at computer-controlled rate β and buffer at rate γ. The output concentration [L], seen by cells in the flow cell, perfused at rate δ, was proportional to the rate β, provided that γ≫β. Under these conditions, the time for mixing, τmix, was fixed at Vmix/γ. Thus, by programming the pump controlling β, arbitrary waveforms could be generated as a function of time. In our experiments, Vmix≈120 μl and γ>1200 μl/min, so τmix was <6 s. The rate δ does not affect τmix, but affects the exchange time τex of fluid in the flow cell and the polyethylene tubing connecting it to the mixing chamber, so this was also kept relatively high (∼1000 μl/min). (B) We confirmed, by measuring the optical density of bromothymol blue (black points), that temporal gradients of arbitrary function could be programmed (blue curve) provided that the frequency of the programmed signal did not exceed the mixing frequency νmix=(2πτmix)−1. This condition was violated for the blue segment at the left end of the plot.

Similar articles

Cited by

References

    1. Alon U (2007) An Introduction to Systems Biology. Boca Raton, FL: CRC Press
    1. Alon U, Surette MG, Barkai N, Leibler S (1999) Robustness in bacterial chemotaxis. Nature 397: 168–171 - PubMed
    1. Andrews BW, Yi TM, Iglesias PA (2006) Optimal noise filtering in the chemotactic response of Escherichia coli. PLoS Comput Biol 2: e154. - PMC - PubMed
    1. Antommattei FM, Munzner JB, Weis RM (2004) Ligand-specific activation of Escherichia coli chemoreceptor transmethylation. J Bacteriol 186: 7556–7563 - PMC - PubMed
    1. Armstrong JB, Adler J, Dahl MM (1967) Nonchemotactic mutants of Escherichia coli. J Bacteriol 93: 390–398 - PMC - PubMed

Publication types