

Analysis of protein complexes through model-based biclustering of label-free quantitative AP-MS data
- PMID: 20571534
- PMCID: PMC2913403
- DOI: 10.1038/msb.2010.41
Analysis of protein complexes through model-based biclustering of label-free quantitative AP-MS data
Abstract
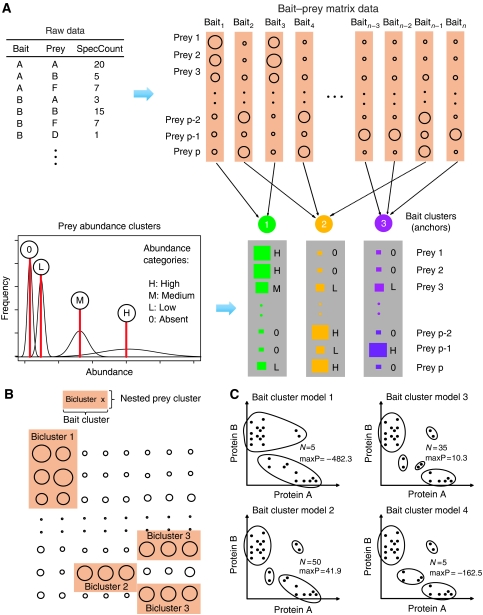
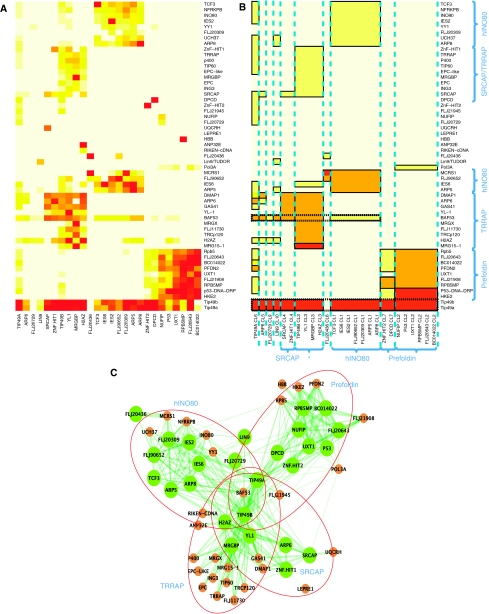
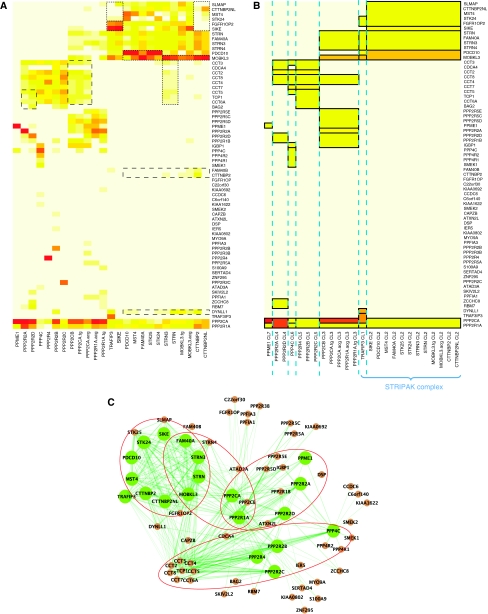
Affinity purification followed by mass spectrometry (AP-MS) has become a common approach for identifying protein-protein interactions (PPIs) and complexes. However, data analysis and visualization often rely on generic approaches that do not take advantage of the quantitative nature of AP-MS. We present a novel computational method, nested clustering, for biclustering of label-free quantitative AP-MS data. Our approach forms bait clusters based on the similarity of quantitative interaction profiles and identifies submatrices of prey proteins showing consistent quantitative association within bait clusters. In doing so, nested clustering effectively addresses the problem of overrepresentation of interactions involving baits proteins as compared with proteins only identified as preys. The method does not require specification of the number of bait clusters, which is an advantage against existing model-based clustering methods. We illustrate the performance of the algorithm using two published intermediate scale human PPI data sets, which are representative of the AP-MS data generated from mammalian cells. We also discuss general challenges of analyzing and interpreting clustering results in the context of AP-MS data.
Conflict of interest statement
The authors declare that they have no conflict of interest.
Figures
References
-
- Aebersold R, Mann M (2003) Mass spectrometry-based proteomics. Nature 422: 198–207 - PubMed
-
- Antoniak CE (1974) Mixtures of Dirichlet processes with applications to Bayesian nonparametric problems. Ann Stat 2: 1152–1174
-
- Braun P, Tasan M, Dreze M, Barrios-Rodiles M, Lemmens I, Yu H, Sahalie JM, Murray RR, Roncari L, de Smet AS, Venkatesan K, Rual JF, Vandenhaute J, Cusick ME, Pawson T, Hill DE, Tavernier J, Wrana JL, Roth FP, Vidal M (2009) An experimentally derived confidence score for binary protein-protein interactions. Nat Methods 6: 91–97 - PMC - PubMed
-
- Breitkreutz A, Choi H, Sharom J, Boucher L, Neduva V, Larsen B, Lin Z-Y, Breitkreutz B-J, Stark C, Liu G, Ahn J, Dewar-Darch D, Reguly T, Tang X, Almeida R, Qin ZS, Pawson T, Gingras A-C, Nesvizhskii AI, Tyers M (2010) Global architecture of the yeast protein kinase and phosphatase interaction network. Science 328: 1043–1046 - PMC - PubMed
-
- Chen GI, Gingras AC (2007) Affinity-purification mass spectrometry (AP-MS) of serine/threonine phosphatases. Methods 42: 298–305 - PubMed
Publication types
MeSH terms
Substances
Grants and funding
LinkOut - more resources
Full Text Sources
Molecular Biology Databases
Miscellaneous
