. 2010 Jun 23:10:187.
doi: 10.1186/1471-2334-10-187.

Mapping the risk of avian influenza in wild birds in the US

Affiliations

Mapping the risk of avian influenza in wild birds in the US

Trevon L Fuller et al. BMC Infect Dis. .

Abstract

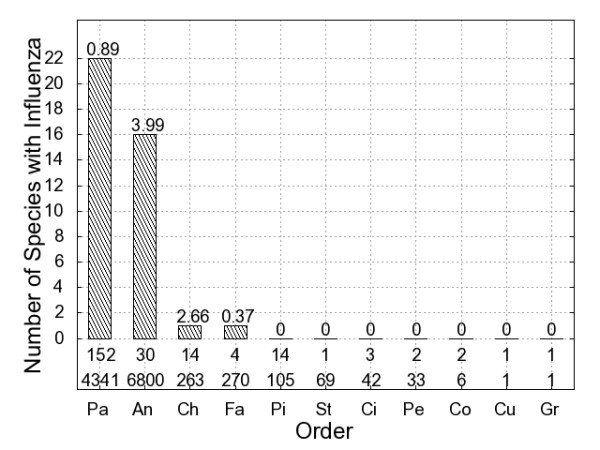
Background: Avian influenza virus (AIV) is an important public health issue because pandemic influenza viruses in people have contained genes from viruses that infect birds. The H5 and H7 AIV subtypes have periodically mutated from low pathogenicity to high pathogenicity form. Analysis of the geographic distribution of AIV can identify areas where reassortment events might occur and how high pathogenicity influenza might travel if it enters wild bird populations in the US. Modelling the number of AIV cases is important because the rate of co-infection with multiple AIV subtypes increases with the number of cases and co-infection is the source of reassortment events that give rise to new strains of influenza, which occurred before the 1968 pandemic. Aquatic birds in the orders Anseriformes and Charadriiformes have been recognized as reservoirs of AIV since the 1970s. However, little is known about influenza prevalence in terrestrial birds in the order Passeriformes. Since passerines share the same habitat as poultry, they may be more effective transmitters of the disease to humans than aquatic birds. We analyze 152 passerine species including the American Robin (Turdus migratorius) and Swainson's Thrush (Catharus ustulatus).

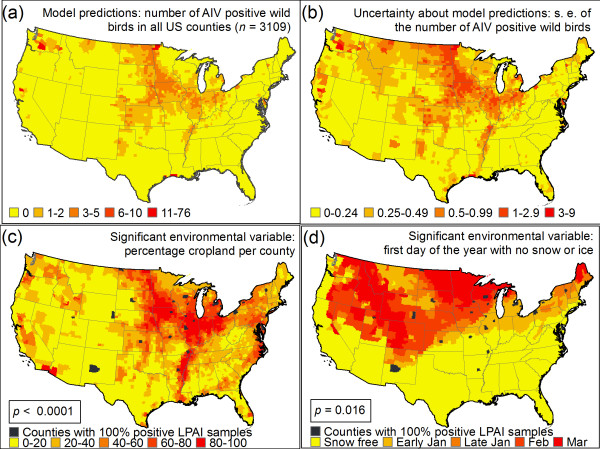
Methods: We formulate a regression model to predict AIV cases throughout the US at the county scale as a function of 12 environmental variables, sampling effort, and proximity to other counties with influenza outbreaks. Our analysis did not distinguish between types of influenza, including low or highly pathogenic forms.

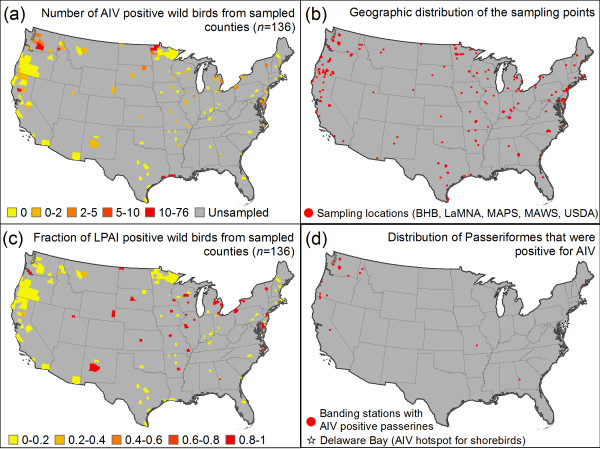
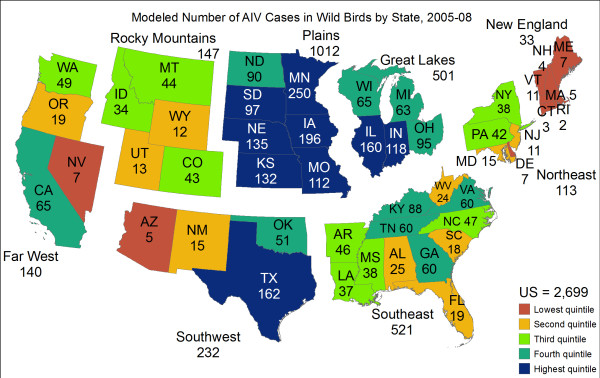
Results: Analysis of 13,046 cloacal samples collected from 225 bird species in 41 US states between 2005 and 2008 indicates that the average prevalence of influenza in passerines is greater than the prevalence in eight other avian orders. Our regression model identifies the Great Plains and the Pacific Northwest as high-risk areas for AIV. Highly significant predictors of AIV include the amount of harvested cropland and the first day of the year when a county is snow free.

Conclusions: Although the prevalence of influenza in waterfowl has long been appreciated, we show that 22 species of song birds and perching birds (order Passeriformes) are influenza reservoirs in the contiguous US.


Figures

Figure 1
Figure 1
Empirical data: AIV cases in the contiguous US. (a) Number of positive wild birds in each of the sampled counties and county equivalents (n = 136). The data are partitioned into classes based on Jenks' natural breaks. (b) Locations of the bird banding stations where cloacal samples were collected as part of the LaMNA, MAPS, and MAWS banding networks. Also shown are the locations of geographic data from BioHealthBase (BHB) and the USDA. (c) Fraction of AIV positive samples. The upper Mississippi River basin and eastern Plains regions are hotspots based on the fraction of positives. (d) Distribution of AIV-positive samples from Passeriformes.
Figure 2
Figure 2
Influenza prevalence among avian orders. Each bar represents one order of birds in the contiguous US. The height of the bar indicates that number of species belonging to the order that tested positive for AIV. The number above each bar is the % of cloacal samples that were AIV-positive. An = Anseriformes, Ch = Charadriiformes, Ci = Ciconiiformes, Co = Columbiformes, Cu = Cuculiformes, Fa = Falconiformes, Gr = Gruiformes, Pa = Passeriformes, Pe = Pelecaniformes, Pi = Piciformes, and St = Strigiformes. The first number below the bar is the number of species that we tested from that order. The second number is the number of samples that we tested from all of the species belonging to the order (see Additional file 2, Table S1 for details).
Figure 3
Figure 3
Predictions of the spatial model. (a) Predictions for AIV cases in sampled and unsampled counties (n = 3109). R.m.s.e.: 6.33 cases per county; (b) Uncertainty associated with the model predictions in (a): standard error of the number of predicted cases of AIV in wild birds; (c) An important environmental variable for explaining AIV cases: % cropland per county; (d) Another important environmental variable: first day of the year with no snow or ice. Most counties with a high % of AIV positive-wild birds have a high % crop of cropland and cold climate measured as snow or ice-cover in January. This is compatible with the observation that the AI virus can survive outside of the host for a longer time period in a cold environment.
Figure 4
Figure 4
Modelled number of AIV cases in wild birds per US state and region, 2006-2008. States are colored based on quintiles so that states that are in the top 20% with respect to the number of AIV cases are colored dark blue and states in the bottom 20% are red-orange. The symbology is adapted from a map of US GDP [84].

Similar articles

Cited by

References

    1. Bush RM. In: Encyclopedia of Infectious Diseases: Modern Methodologies. Tibayrenc M Hoboken, editor. New Jersey, USA: John Wiley & Sons; 2007. Influenza evolution; pp. 199–214. full_text.
    1. Clark L, Hall J. Avian influenza in wild birds: status as reservoirs, and risks to humans and agriculture. Ornithological Monographs. 2006;60:3–29. doi: 10.1642/0078-6594(2006)60[3:AIIWBS]2.0.CO;2. - DOI
    1. Webster RG, Bean WJ, Gorman OT, Chambers TM, Kawaoka Y. Evolution and ecology of influenza A viruses. Microbiological Reviews. 1992;56:152–179. - PMC - PubMed
    1. Bean WJ, Kawaoka Y, Wood JM, Pearson JE, Webster RG. Characterization of virulent and avirulent A/Chicken/Pennsylvania/81 influenza A viruses: potential role of defective interfering RNAs in nature. Journal of Virology. 1985;54:151–160. - PMC - PubMed
    1. McLeod A. In: Avian Influenza. Swayne DE, editor. Ames, Iowa: Blackwell Publishing; 2008. The economics of avian influenza; pp. 537–560. full_text.

Publication types