. 2010 Jun 24:5:27.
doi: 10.1186/1750-1326-5-27.

First evidence of overlaps between HIV-Associated Dementia (HAD) and non-viral neurodegenerative diseases: proteomic analysis of the frontal cortex from HIV+ patients with and without dementia

Affiliations

First evidence of overlaps between HIV-Associated Dementia (HAD) and non-viral neurodegenerative diseases: proteomic analysis of the frontal cortex from HIV+ patients with and without dementia

Li Zhou et al. Mol Neurodegener. .

Abstract

Background: The pathogenesis of HIV-associated dementia (HAD) is poorly understood. To date, detailed proteomic fingerprinting directly from autopsied brain tissues of HAD and HIV non-dementia patients has not been performed.

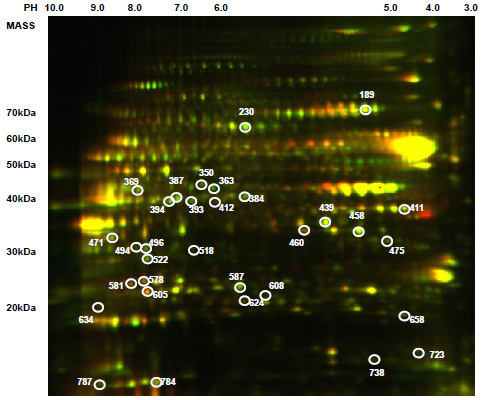
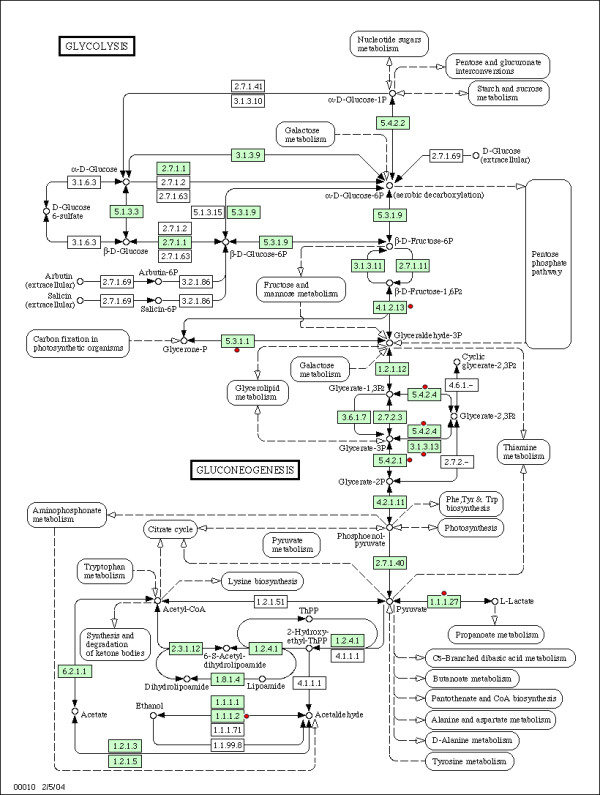
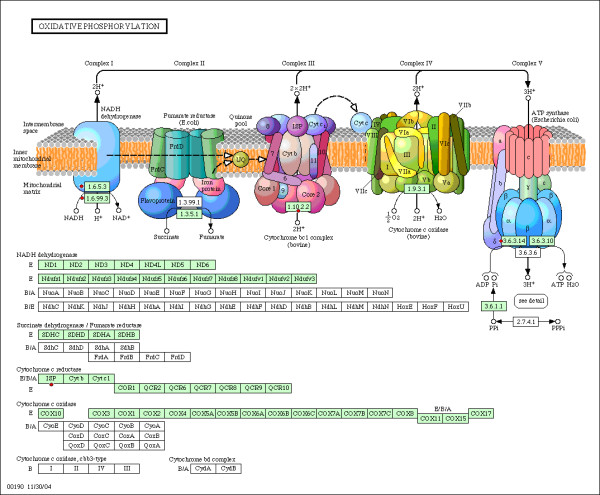
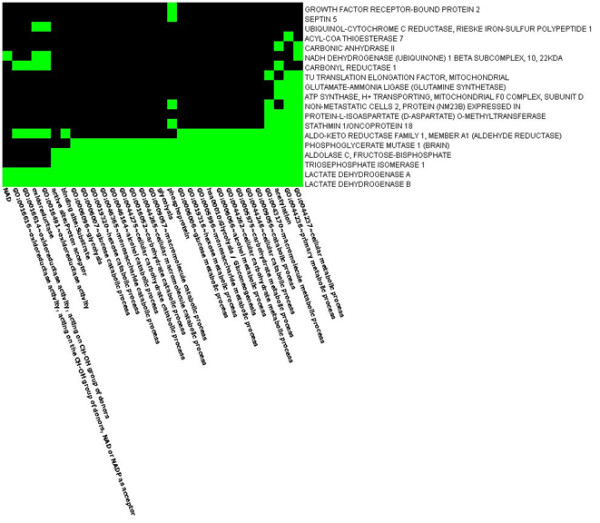
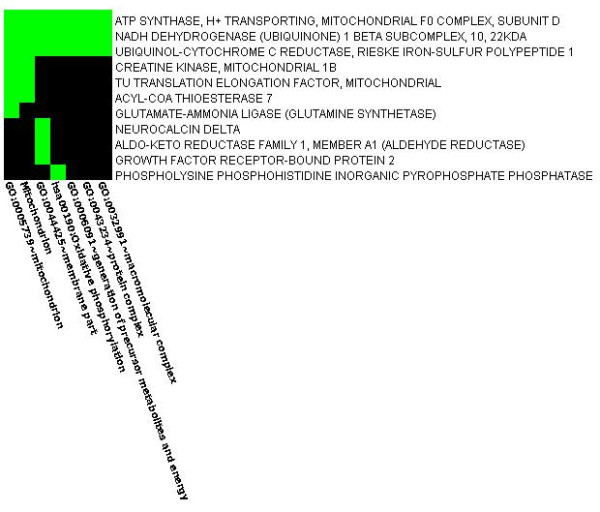
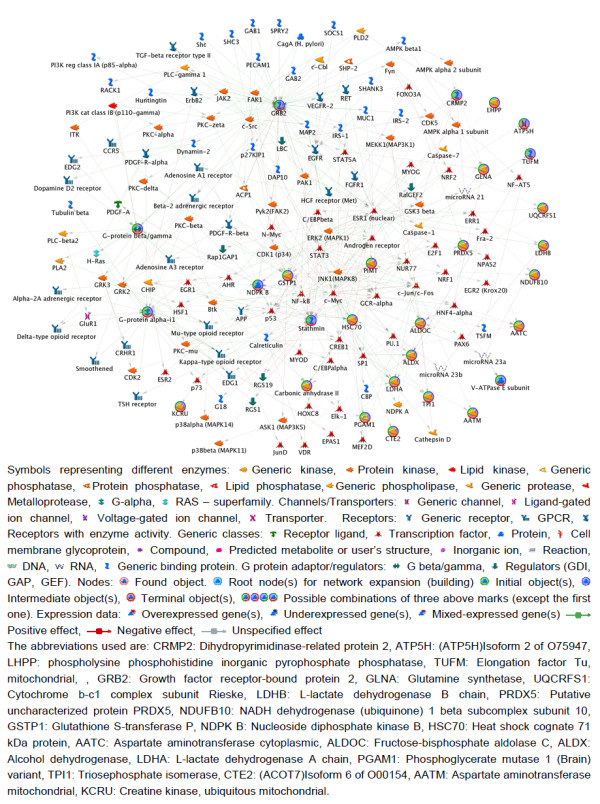
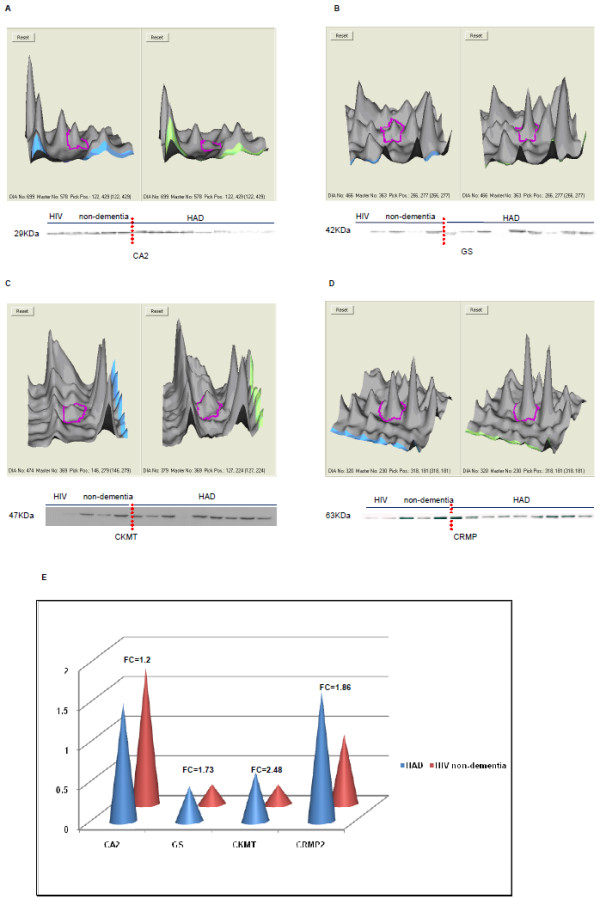
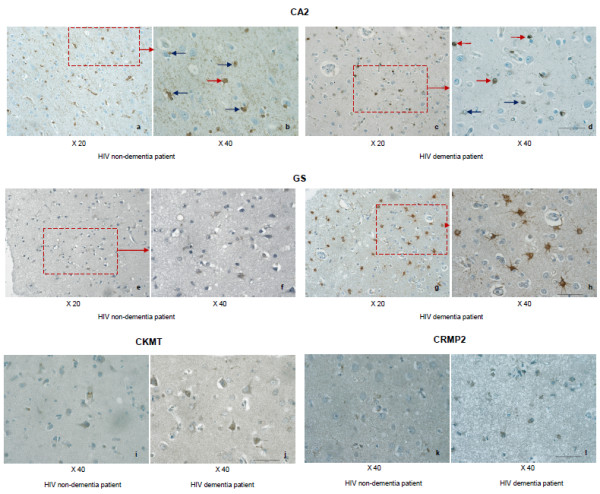
Result: Here, we have analyzed total proteins from the frontal cortex of 9 HAD and 5 HIV non-dementia patients. Using 2-Dimensional differential in-gel electrophoresis (2-DIGE) to analyze the brain tissue proteome, 76 differentially expressed proteins (p < 0.05; fold change>1.25) were identified between HAD and HIV non-dementia patients, of which 36 protein spots (based on 3D appearance of spots on the images) were chosen for the mass spectrometry analysis. The large majority of identified proteins were represented in the energy metabolic (mitochondria) and signal transduction pathways. Furthermore, over 90% of the protein candidates are common to both HAD and other non-viral neurodegenerative disease, such as Alzheimer's disease. The data was further validated using specific antibodies to 4 proteins (CA2, GS, CKMT and CRMP2) by western blot (WB) in the same samples used for 2D-DIGE, with additional confirmation by immunohistochemitsry (IHC) using frontal lobe tissue from different HAD and HIV+ non-dementia patients. The validation for all 4 antibodies by WB and IHC was in concordance with the DIGE results, lending further credence to the current findings.

Conclusion: These results suggest not only convergent pathogenetic pathways for the two diseases but also the possibility of increased Alzheimer's disease (AD) susceptibility in HAD patients whose life expectancy has been significantly increased by highly active antiretroviral therapy.


Figures

Figure 1
Figure 1
Master gel from from 2D-DIGE experiment. Master gel was chosen by DeCyder software automatically based on the spot numbers identified across all the gels. On this gel, one HAD sample (Cy5-labeled), one HIV non-dementia patient (Cy3-labeled) and an internal standard (Cy2-labeled) were included. First dimension, IEF pH 3 to 10 NL (right to left); second dimension, SDS (8-18%) polyacrylamide gel electrophoresis. White circles and numbers indicate identified proteins that are listed in Table 1.
Figure 2
Figure 2
Illustration of altered components of HAD frontal cortex in the Glycolysis/Gluconeogenesis pathway. Figure 2 depict the classical Glycolysis/Gluconeogenesis pathway obtained from the KEGG pathway database http://www.genome.jp/kegg/. The genes, whose corresponding proteins have been found to differentially change in the current study, are highlighted in red and are denoted by dots. The protein details are listed in Table 1.
Figure 3
Figure 3
Illustration of altered components of HAD frontal cortex in the Oxidative phosphorylation pathway. Figure 3 depict the classical Oxidative phosphorylation pathway obtained from the KEGG pathway database. The genes, whose corresponding proteins have been found changed in the current study, are highlighted in red and are denoted by dots. The protein details are listed in Table 1.
Figure 4
Figure 4
Heatmap showing evidence of protein enrichment in the Glycolysis/Gluconeogenesis pathway. Figure 4 shows the heatmap depicting enrichment of proteins in the Glycolysis/Gluconeogenesis pathway. Rows signify enriched genes and the columns signify related processes within the pathway. Green cells indicate that the corresponding genes and terms are associated positively according to the literature, whereas the black cells indicate the association not yet been reported.
Figure 5
Figure 5
Heatmap showing evidence of protein enrichment in the Oxidative phosphorylation pathway. Figure 5 is the heatmap showing enrichment of proteins in the Oxidative phosphorylation pathway. Rows signify enriched genes and the columns signify related processes within the pathway. Green cells indicate that the corresponding genes and terms are associated positively according to the literature, whereas the black cells indicate the association not previously reported.
Figure 6
Figure 6
GeneGo network. Proteins identified in this study were uploaded to the Metacore software (GeneGo corp). The generated network shows significant involvement of proteins in the metabolic process. Interactions between proteins are denoted by lines. Green lines indicate activation, while the red lines indicate inhibition. Nodes are represented by distinct shapes and colors.
Figure 7
Figure 7
3D DeCyder image and corresponding Western blot analysis for four representative proteins. Each pair of protein spots (Cy3-and Cy5-labeled) in 3D views is shown together with the corresponding western blot analysis (A: CA2, B: GS, C: CKMT, D: CRMP2). The 3D peak of each protein was generated based on the pixel intensity versus pixel area, whereby the peak area correlated with the distribution of a given protein spot on the gel and then normalized by the standard (Cy-2-labeled). 3D images were obtained from DeCyder software. The western blot results correlated with the 2D-DIGE data. Sample orders in western blot analysis were the same as shown in Additional file 4, from right to left. Sample #2434 and #H0011db were absent in GS and CKMT proteins. Semi-quantitative western blot analysis (E) represented the relative protein level (standardized by Actin) in HAD and HIV non-dementia patients. Fold-change in values was labelled on the top of each paired comparison. The quantification analysis demonstrated the trend similar to the one observed in 2D-DIGE for HAD patients when compared to HIV non-dementia patients (p < 0.05).
Figure 8
Figure 8
Immunohistochemical staining of four representative proteins in HAD and HIV non-dementia patients in the frontal lobe. Immunohistochemical evaluation of CA2 (a, b, c and d), GS (e, f, g and h), CKMT (i and j) and CRMP2 monoclonal antibodies (k and l) for staining the frontal lobe from HAD and HIV non-dementia patients. Relatively less CA2 staining, but more focal and neuronal staining was observed in HAD patient, as seen at different magnifications (a: x20, b: x40) compared to a more spread out astrocyte staining in HIV non-dementia patients (c: x20 and d: x40). The red arrows on b and d showed neuronal staining, while the blue arrows show astrocytic staining. Extensive GS staining was seen in HAD brain (g: x20 and h: x40), whereas in the HIV non-dementia patient the staining was significantly weaker (e: x20 and f: x40). The staining with CKMT and CRMP2 antibodies showed relative weaker signals due to low antigen levels. However, the clear differences are still noticeable for both antibodies. For CKMT, in HAD patient (j), there are strongly stained cells, along with several weakly stained cells around, whereas in HIV non-dementia patients (i), only very limited number of stained cells with only fewer weakly stained cells around. This contrast was stronger in CRMP2 staining (k and l) in comparison to CKMT.

Similar articles

Cited by

References

    1. Cysique LA, Maruff P, Brew BJ. Prevalence and pattern of neuropsychological impairment in human immunodeficiency virus-infected/acquired immunodeficiency syndrome (HIV/AIDS) patients across pre- and post-highly active antiretroviral therapy eras: a combined study of two cohorts. Journal of neurovirology. 2004;10:350–357. doi: 10.1080/13550280490521078. - DOI - PubMed
    1. Joseph J, Clifford D, Douglas SD, Fox H, Gendelman HE, Gonzalez-Scarano F, Grant I, Major E, McArthur J. Planning Future Strategies for Domestic and International NeuroAIDS Research, July 24-25, 2008. J Neuroimmune Pharmacol. 2009;4:283–297. doi: 10.1007/s11481-009-9159-1. - DOI - PMC - PubMed
    1. Dore GJ, McDonald A, Li Y, Kaldor JM, Brew BJ. Marked improvement in survival following AIDS dementia complex in the era of highly active antiretroviral therapy. AIDS (London, England) 2003;17:1539–1545. - PubMed
    1. Alisky JM. The coming problem of HIV-associated Alzheimer's disease. Medical hypotheses. 2007;69:1140–1143. doi: 10.1016/j.mehy.2007.02.030. - DOI - PubMed
    1. Sui Y, Potula R, Pinson D, Adany I, Li Z, Day J, Buch E, Segebrecht J, Villinger F, Liu Z, Huang M, Narayan O, Buch S. Microarray analysis of cytokine and chemokine genes in the brains of macaques with SHIV-encephalitis. Journal of medical primatology. 2003;32:229–239. doi: 10.1034/j.1600-0684.2003.00030.x. - DOI - PubMed

LinkOut - more resources