. 2011 Feb 6;8(55):233-43.
doi: 10.1098/rsif.2010.0216. Epub 2010 Jun 23.

Spatial dynamics of the 1918 influenza pandemic in England, Wales and the United States

Affiliations

Spatial dynamics of the 1918 influenza pandemic in England, Wales and the United States

Rosalind M Eggo et al. J R Soc Interface. .

Abstract

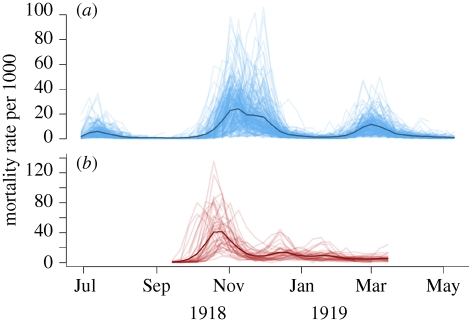
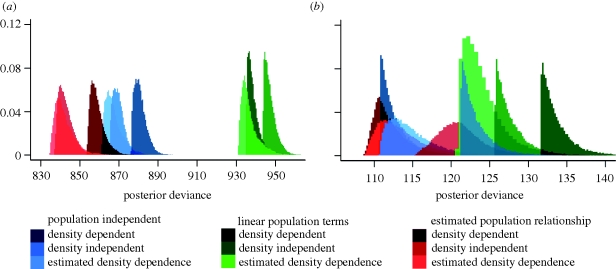
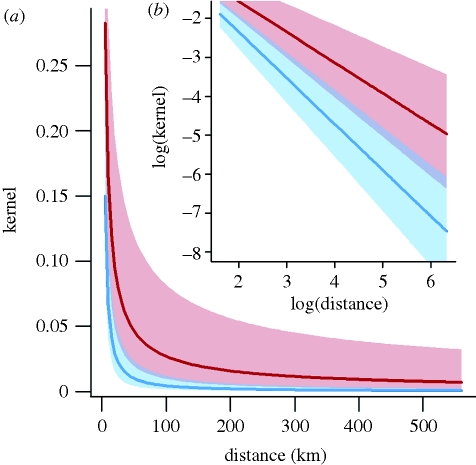
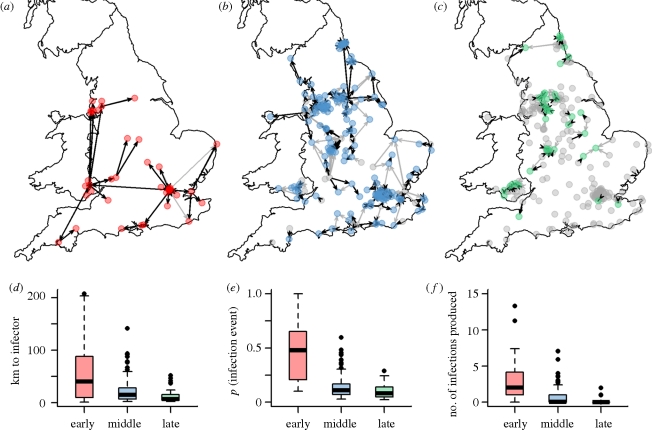
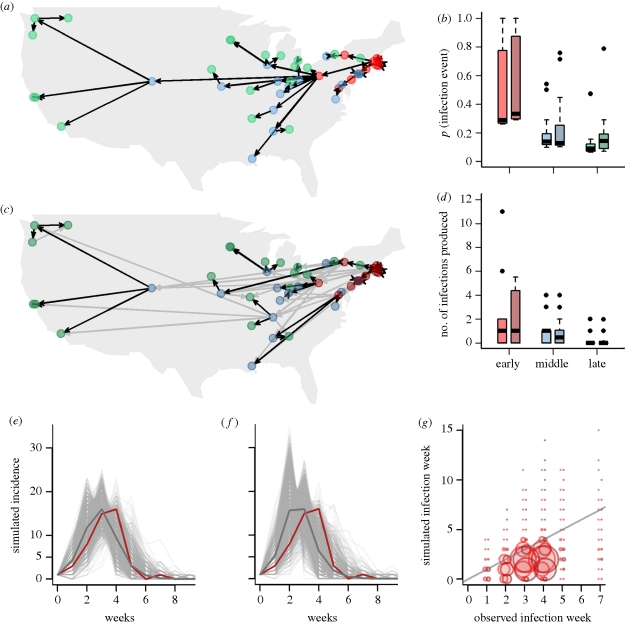
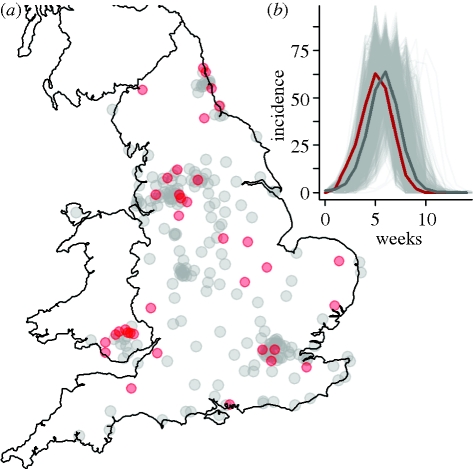
There is still limited understanding of key determinants of spatial spread of influenza. The 1918 pandemic provides an opportunity to elucidate spatial determinants of spread on a large scale. To better characterize the spread of the 1918 major wave, we fitted a range of city-to-city transmission models to mortality data collected for 246 population centres in England and Wales and 47 cities in the US. Using a gravity model for city-to-city contacts, we explored the effect of population size and distance on the spread of disease and tested assumptions regarding density dependence in connectivity between cities. We employed Bayesian Markov Chain Monte Carlo methods to estimate parameters of the model for population, infectivity, distance and density dependence. We inferred the most likely transmission trees for both countries. For England and Wales, a model that estimated the degree of density dependence in connectivity between cities was preferable by deviance information criterion comparison. Early in the major wave, long distance infective interactions predominated, with local infection events more likely as the epidemic became widespread. For the US, with fewer more widely dispersed cities, statistical power was lacking to estimate population size dependence or the degree of density dependence, with the preferred model depending on distance only. We find that parameters estimated from the England and Wales dataset can be applied to the US data with no likelihood penalty.


Figures

Figure 1.
Figure 1.
The two mortality incidence datasets. The darker line is a non-population weighted mean of all cities. (a) 246 population centres in England and Wales; (b) 47 cities in the US.
Figure 2.
Figure 2.
Posterior deviances of nine models for comparison in (a) England and Wales, and (b) the US. Blue models are population independent, green have a linear relationship with source and destination population size, and red estimate the relationship between the population sizes of both source and destination cities and connectivity. In each case, the darkest curve represents the density-dependent formulation, medium the density independent and the lightest is the model which estimates the degree of density dependence.
Figure 3.
Figure 3.
Best-fit distance kernels for England and Wales (blue) and US (red). Posterior median is shown as a darker line and 95% credible intervals are given by the shaded region. (a) Unlogged and (b) logged.
Figure 4.
Figure 4.
(a–c) The most likely infector tree for each stage of the epidemic in England and Wales. Weeks 0–4 are the (a) early stage of the epidemic, (b) weeks 5–7 are the middle and (c) weeks 8–10 are late in the epidemic. Black lines represent a consistent infector designation above 70% and grey shows infection events less frequent than 70% of trees. (d–f) comparison of the distance to inferred infector, probability of each infection event (arrows in (ac)) and the distribution of number of new infections created by each city in each phase of the epidemic. These values are weighted for frequency within the 1000 realizations.
Figure 5.
Figure 5.
(a) The most likely US infection tree for 1000 parameter sets from the distance-only constant-infectivity model. Arrows show infector and infected cities. Cities infected early in the epidemic (week 0–2) are shown in red, those infected in the middle (week 3) are in blue and cities infected late in the epidemic (weeks 4–7) are shown in green. (c) The most likely tree for the US using 1000 parameter sets fitted to the England and Wales data. Black lines represent a consistent infector designation above 70% and grey shows any frequency of most likely infection event. (b,d) Comparison of firstly the probability of each infection event (arrows in (a) and (c)) for each stage of the epidemic, and secondly the distribution of number of new infections created by each city in each phase of the epidemic. These values are weighted by frequency within the 1000 realizations. ((e, f) The incidence curves for 1000 simulations of the epidemic from 1 start city for the distance-only constant-infectivity model (e) and the England and Wales parameters model (f)). Simulation means are shown in dark grey and the observed epidemic curve is shown in red. (g) The simulated week of infection against the observed week of infection for the two models. The England and Wales parameters model is darker. r = 0.49 and 0.48, respectively.
Figure 6.
Figure 6.
(a) Cities that lie outside of the 75% probability interval for infection week are shown in red. (b) 1000 simulations from the best model—single infected-city parameter model in England and Wales. Dark grey is the simulation mean, red is the observed epidemic curve.

Similar articles

Cited by

References

    1. Riley S., et al. 2003. Transmission dynamics of the etiological agent of SARS in Hong Kong: impact of public health interventions. Science 300, 1961–196610.1126/science.1086478 (doi:10.1126/science.1086478) - DOI - DOI - PubMed
    1. Ferguson N. M., Cummings D. A., Cauchemez S., Fraser C., Riley S., Meeyai A., Iamsirithaworn S., Burke D. S. 2005. Strategies for containing an emerging influenza pandemic in Southeast Asia. Nature 437, 209–21410.1038/nature04017 (doi:10.1038/nature04017) - DOI - DOI - PubMed
    1. Ferguson N. M., Cummings D. A. T., Fraser C., Cajka J. C., Cooley P. C., Burke D. S. 2006. Strategies for mitigating an influenza pandemic. Nature 442, 448–45210.1038/nature04795 (doi:10.1038/nature04795) - DOI - DOI - PMC - PubMed
    1. Germann T. C., Kadau K., Longini I. M., Macken C. A. 2006. Mitigation strategies for pandemic influenza in the United States. Proc. Natl Acad. Sci. USA 103, 5935–594010.1073/pnas.0601266103 (doi:10.1073/pnas.0601266103) - DOI - DOI - PMC - PubMed
    1. Viboud C., et al. 2006. Synchrony, waves, and spatial hierarchies in the spread of influenza. Science 312, 447–45110.1126/science.1125237 (doi:10.1126/science.1125237) - DOI - DOI - PubMed

Publication types