. 2010 Aug;24(8):1543-58.
doi: 10.1210/me.2009-0381. Epub 2010 Jun 23.

Signaling from the secretory granule to the nucleus: Uhmk1 and PAM

Affiliations

Signaling from the secretory granule to the nucleus: Uhmk1 and PAM

Victor P Francone et al. Mol Endocrinol. 2010 Aug.

Abstract

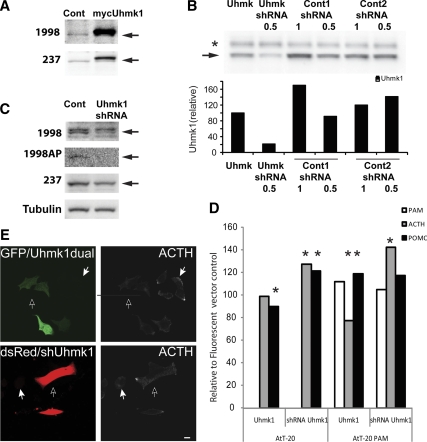
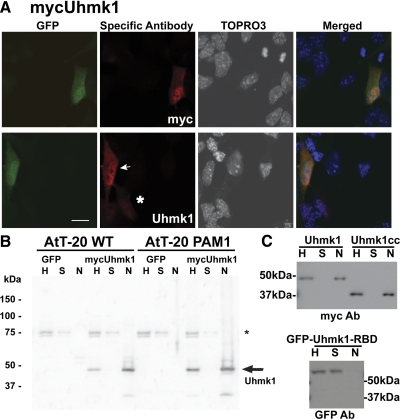
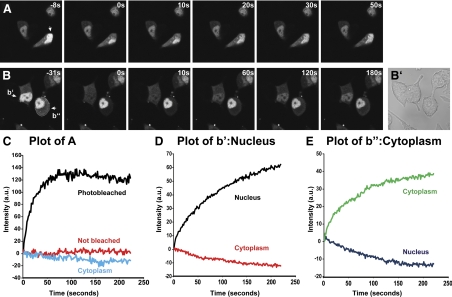
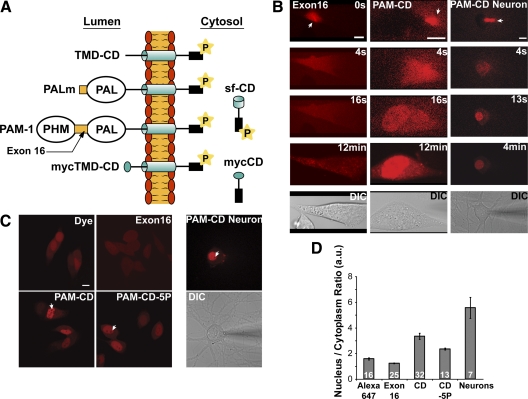
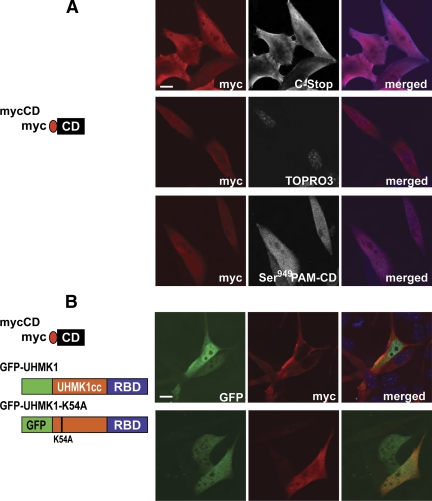
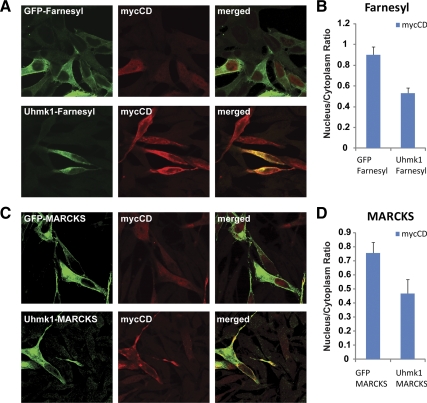
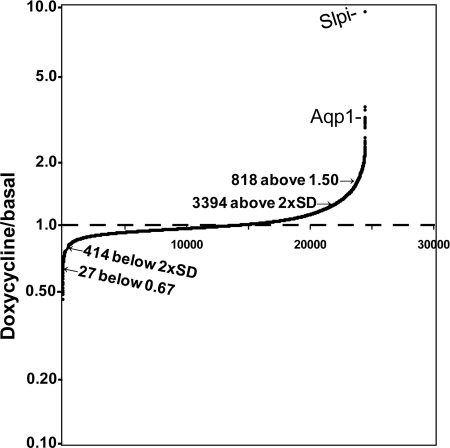
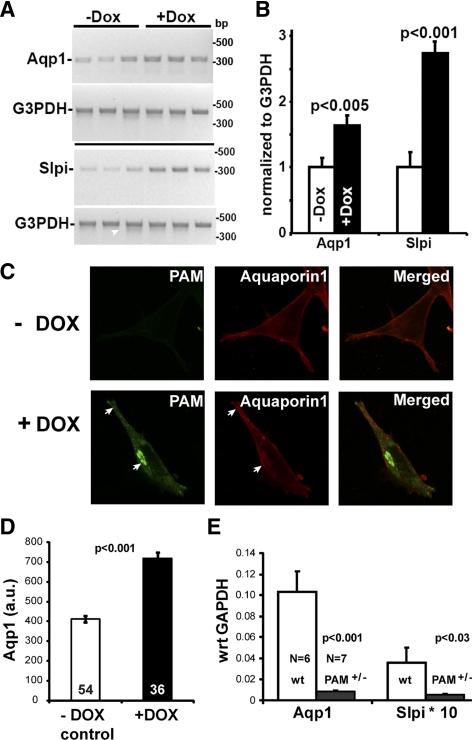
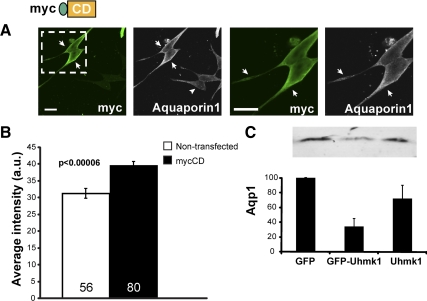
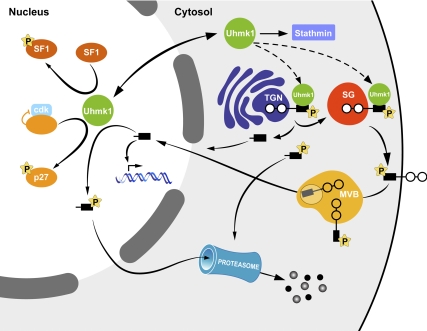
Neurons and endocrine cells package peptides in secretory granules (large dense-core vesicles) for storage and stimulated release. Studies of peptidylglycine alpha-amidating monooxygenase (PAM), an essential secretory granule membrane enzyme, revealed a pathway that can relay information from secretory granules to the nucleus, resulting in alterations in gene expression. The cytosolic domain (CD) of PAM, a type 1 membrane enzyme essential for the production of amidated peptides, is basally phosphorylated by U2AF homology motif kinase 1 (Uhmk1) and other Ser/Thr kinases. Proopiomelanocortin processing in AtT-20 corticotrope tumor cells was increased when Uhmk1 expression was reduced. Uhmk1 was concentrated in the nucleus, but cycled rapidly between nucleus and cytosol. Endoproteolytic cleavage of PAM releases a soluble CD fragment that localizes to the nucleus. Localization of PAM-CD to the nucleus was decreased when PAM-CD with phosphomimetic mutations was examined and when active Uhmk1 was simultaneously overexpressed. Membrane-tethering Uhmk1 did not eliminate its ability to exclude PAM-CD from the nucleus, suggesting that cytosolic Uhmk1 could cause this response. Microarray analysis demonstrated the ability of PAM to increase expression of a small subset of genes, including aquaporin 1 (Aqp1) in AtT-20 cells. Aqp1 mRNA levels were higher in wild-type mice than in mice heterozygous for PAM, indicating that a similar relationship occurs in vivo. Expression of PAM-CD also increased Aqp1 levels whereas expression of Uhmk1 diminished Aqp1 expression. The outlines of a pathway that ties secretory granule metabolism to the transcriptome are thus apparent.


Figures

Figure 1
Figure 1
Uhmk1 is expressed in AtT-20 cells and affects POMC metabolism. A, Control AtT-20 cells or AtT-20 cells transiently expressing mycUhmk1 were subjected to Western blot analysis using the indicated Uhmk1 antibodies; arrows mark endogenous Uhmk1. B, pEAK Rapid cells transiently expressing mycUhmk1 were cotransfected with vectors (1 or 0.5 μg, as indicated) encoding Uhmk1 shRNA or two control shRNAs; Western blot analysis was performed using JH1998. Arrow, endogenous Uhmk1; *, nonspecific band. Quantification is shown below. C, Control AtT-20 cells or AtT-20 cells expressing Uhmk1 shRNA for 48 h were subjected to Western blot analysis using the indicated Uhmk1 or tubulin antisera; JH1998 AP, affinity-purified antibody; arrows, endogenous Uhmk1. D, Ratiometric analysis of AtT-20 and AtT-20 PAM-1 cells expressing mycUhmk1 (along with GFP in a dual promoter vector) vs. the GFP control or Uhmk1 shRNA/DsRed vs. the average of the two control shRNA/DsRed vectors. Fixed cells stained for cleaved ACTH or total POMC were visualized with Cy5-tagged secondary antibody. *, Ratios of samples with significant differences (P < 0.05 by t test and Kolmogorov-Smirnov). E, Representative AtT-20 PAM-1 cells expressing GFP and Uhmk1 from the dual promoter vector or dsRed/shUhmk1 24 h after transfection using antibody to ACTH; open arrows mark transfected cells; solid arrows mark nontransfected cells. Scale bar, 10 μm. Cont, Control.
Figure 2
Figure 2
Uhmk1 is present in both nucleus and cytosol. A, AtT-20 cells expressing mycUhmk1 and GFP were examined 24 h after transfection using antibody to myc or Uhmk1. Primary antibody was visualized using Cy3-tagged secondary antibody whereas nuclei were visualized using TOPRO3. Arrow marks moderate and asterisk marks low expressing cell; scale bar, 10μm. B, MycUhmk1 was transiently expressed in AtT-20 or PAM-1 AtT-20 cells; nuclei were isolated and 1% of the homogenate (H), supernatant (S), and nuclear (N) fractions was analyzed by SDS-PAGE; exogenous Uhmk1 was visualized using rabbit polyclonal antibody JH1998. *, Nonspecific band. C, AtT-20 PAM-1 cells were transfected with vectors encoding mycUhmk1, mycUhmk1cc, or GFP-Uhmk1-RBD. Cells were harvested the next day, and nuclei were isolated and analyzed. Antibodies used for Western blots are indicated below each blot. Ab, Antibody.
Figure 3
Figure 3
Uhmk1 shuttles into and out of the nucleus. FRAP experiments were performed on AtT-20 cells transfected the previous day with vector encoding GFP-Uhmk1. A, In the cell marked by the arrow, the indicated region of the nucleus was photobleached; cells were imaged for the next 4 min. B, The nucleus of one cell (b’) and the cytoplasm of another cell (b”) were photobleached as indicated by the white lines and recorded as in A. B’, Phase image after FRAP experiment was completed. C, Fluorescence intensities were quantified in photobleached nuclei, nonbleached nuclei, and cytoplasm. The recovery curve was fit by a single exponential function; f = 78.4 + 3.9(1 − e(−0.06 X)); r = 0.96; P < 0.0001; in this case significant photobleaching was detected, and the curve fitting includes a linear component; f = [41.5 − 0.05 X] + 48.6(1 − e(−0.0424 X)); r = 0.97; P < 0.0001. D, Fluorescence intensities in the entire nucleus and entire cytoplasm of cells b′ (panel D) and b″ (panel E) were quantified. The nuclear recovery curve (D) was fit by a single exponential function: f = 29.5 + 9.8(1 − e(−0.0113 X)); r = 0.99; P < 0.0001. The cytoplasmic recovery curve (panel E) was fit by a single exponential function: f = 53.4 + 22.2(1 − e(−0.0064 X)); r = 0.998; P < 0.0001. Representative experiments are shown.
Figure 4
Figure 4
Recombinant PAM-CD localizes to the nucleus. A, Cleavage of PAM-1 in exon 16 occurs in LDCVs, generating membrane-anchored PAL (PALm); cleavage after PAL produces 22-kDa TMD-CD (8). Intramembrane proteolysis is thought to create soluble, cytosolic sf-CD (16 kDa) (8). The structures of mycTMD-CD and mycCD, which were stably expressed in AtT-20 cells, are shown for comparison. B, Alexa647 labeled PAM-exon16 or PAM-CD was microinjected into AtT-20 cells or neurons; white arrow marks the injection site. Representative confocal images taken at the times indicated are shown along with a differential interference contrast (DIC) image. Scale bars, 10 μm. C, AtT-20 cells or neurons were microinjected with free Alexa647 dye, Alexa647-Exon16, Alexa647-PAM-CD, or Alexa647-PAM-CD-5P (with five phosphomimetic mutations). Images were taken no longer than 2 min after injection. Scale bar, 10 μm. D, Quantification of the nuclear/cytoplasmic ratio of images taken as in panel C; mean ± sem. The number of cells analyzed is indicated. a.u., Arbitrary units.
Figure 5
Figure 5
PAM-CD nuclear localization is affected by Uhmk1 in a kinase activity-dependent manner. A, AtT-20 cells were transfected with vector encoding mycCD alone or (B) cotransfected with vectors encoding mycCD and active GFP-Uhmk1 or inactive GFP-Uhmk1K54A. In both panels A and B, mycCD was detected with myc antibody (red). In panel A, mycCD was also visualized with C-Stop antibody or P-Ser949 antibody, and nuclei were visualized with TOPRO; these images are shown in white in the middle panels and in blue in the right panels. In panel B, GFP-tagged proteins are shown in green. Scale bar, 10 μm.
Figure 6
Figure 6
Uhmk1 tethering to membranes does not prevent nuclear expulsion of PAM-CD. A, AtT-20 cells were cotransfected with vectors encoding mycCD and GFP-Farnesyl or mycCD and Uhmk1-Farnesyl. B, Ratio between the nuclear and the cytoplasmic intensities of the cotransfected cells in panel A; P < 0.001. C, AtT-20 cells were cotransfected with vectors encoding mycCD and GFP-MARCKS or mycCD and Uhmk1-MARCKS. D, Ratio between the nuclear and the cytoplasmic intensities of the cotransfected cells in panel C; P < 0.05. Even when tethered to a membrane anchor, Uhmk1 diminished the ability of mycCD to accumulate in the nucleus. Mean ± sem, nine to 16 cells per bar. MARCKS, Myristoylated alanine-rich C-kinase substrate.
Figure 7
Figure 7
PAM alters expression of a subset of genes in AtT-20 cells: array analysis. Replicate wells of three iPAM subclones were grown in control medium or medium containing 4 μg/ml doxycycline for 48 h; RNA prepared from these six samples was used to probe an Illumina MouseWG-6v2.0 Expression BeadChip. Background was subtracted before calculating the doxycycline/basal expression ratios for genes expressed in each subclone. Average ratios were ordered to yield the cumulative plot shown. The sd in the doxycycline/basal ratio within samples was 12%; the points for 2 sds above and below 1.00 are indicated, with the number of transcripts in each pool. The full data set is provided in Supplemental Table 1.
Figure 8
Figure 8
Verification of array analysis. The cDNA prepared from noninduced and induced iPAM subclones was subjected to RT-PCR using PCR primers for aquaporin1 (Aqp1, NM_007472) and secretory leukocyte peptidase inhibitor (Slpi, NM_011414). G3pdh (NM_008084.2) transcript levels were evaluated simultaneously. A, Ethidium bromide-stained gels are shown. B, RT-PCR signals from Aqp1 or Slpi were normalized to G3PDH for each subclone. Data are mean ± sd; P values calculated using Excel (t test, unequal variances). C, iPAM cells grown in the absence or presence of doxycycline (72 h) were stained simultaneously for PAM-1 (green) and Aqp1 (red). Arrows mark colocalization and accumulation of PAM-1 and Aqp1 at the TGN and at the distal tips of processes, where LDCVs accumulate. D, Aqp1 staining intensity in iPAM cells grown in the absence (n = 54) or presence (n = 36) of doxycycline (as in panel C) was quantified; data are mean ± sem (t test, unequal variance). E, The expression of Aqp1 and Slpi was analyzed by quantitative PCR using pituitary RNA from wild-type control mice (wt; n = 5) and PAM heterozygote mice (PAM+/−; n = 6); G3PDH was analyzed simultaneously, and data were calculated relative to G3PDH (GAPDH) for each sample using the ΔCT method (65); data are mean ± sem. Dox, Doxycycline.
Figure 9
Figure 9
Verification of a role for PAM-CD. A, AtT-20 cells transiently transfected with a vector encoding mycCD were fixed 48 h later and stained simultaneously for endogenous Aqp1 (white) and exogenous mycCD (green; C-stop antibody); boxed area in left panel is enlarged in right panel. Arrows indicate transfected cells; arrowhead indicates nontransfected cell. In cells expressing high levels of mycCD, staining for endogenous Aqp1 increased, especially near the cell surface. Scale bar, 20 μm. B, Aqp1 staining intensity in nontransfected (n = 56) and mycCD-expressing (n = 80) cells was quantified with the Nikon imaging software NIS-Elements; data are mean ± sem (t test, unequal variance). C, AtT-20 cells expressing GFP, GFP-Uhmk1, or GFP and Uhmk1 expressed from a dual promoter vector were FACS sorted; for each sample, 30,000 cells were subjected to Western blot analysis for Aqp1. Error bars, sd (STDEV).
Figure 10
Figure 10
Model outlining the LDCV/nuclear signaling pathway in which PAM and Uhmk1 participate. Under basal conditions, the Uhmk1 site in the CD of PAM (Ser949) is phosphorylated, expediting PAM entry into LDCVs; late stages in the endocytic trafficking of PAM require both phosphorylation and dephosphorylation at this site (8,10). The endoproteolytic cleavage that releases sf-CD is diminished in PAM with a phosphomimetic mutation at Ser949. In addition, Uhmk1 phosphorylation at this site reduces PAM-CD accumulation in the nucleus. Nuclear PAM-CD, acting through pathways that remain to be described, alters the expression of a limited subset of genes, including Aqp1, which is known to affect LDCV metabolism. In the nucleus, Uhmk1, which interacts with nuclear binding sites, can phosphorylate PAM-CD, leading to nuclear exit and rapid proteasomal degradation. PAM-1 with the phosphomimetic Asp949 mutation fails to traverse the endocytic compartment normally, fails to alter cytoskeletal organization or regulated secretion, and fails to generate sf-CD efficiently. Uhmk1 opposes many of the regulatory effects of PAM on LDCV metabolism; the factors that control Uhmk1 localization are unknown. P, Phosphorylation; SG, secretory granule.

Similar articles

Cited by

References

    1. Ferraro F, Eipper BA, Mains RE 2005 Retrieval and reuse of pituitary secretory granule proteins. J Biol Chem 280:25424–25435 - PubMed
    1. Trajkovski M, Mziaut H, Altkrüger A, Ouwendijk J, Knoch KP, Müller S, Solimena M 2004 Nuclear translocation of an ICA512 cytosolic fragment couples granule exocytosis and insulin expression in β-cells. J Cell Biol 167:1063–1074 - PMC - PubMed
    1. Vo YP, Hutton JC, Angleson JK 2004 Recycling of the dense-core vesicle membrane protein phogrin in Min6 β-cells. Biochem Biophys Res Commun 324:1004–1010 - PubMed
    1. Ciccotosto GD, Schiller MR, Eipper BA, Mains RE 1999 Induction of integral membrane PAM expression in AtT-20 cells alters the storage and trafficking of POMC and PC1. J Cell Biol 144:459–471 - PMC - PubMed
    1. Milgram SL, Mains RE, Eipper BA 1996 Identification of routing determinants in the cytosolic domain of a secretory granule-associated integral membrane protein. J Biol Chem 271:17526–17535 - PubMed

Publication types

MeSH terms

Substances