. 2010 Aug 1;137(15):2483-92.
doi: 10.1242/dev.048363. Epub 2010 Jun 23.

Ring1B and Suv39h1 delineate distinct chromatin states at bivalent genes during early mouse lineage commitment

Affiliations

Ring1B and Suv39h1 delineate distinct chromatin states at bivalent genes during early mouse lineage commitment

Olivia Alder et al. Development. .

Abstract

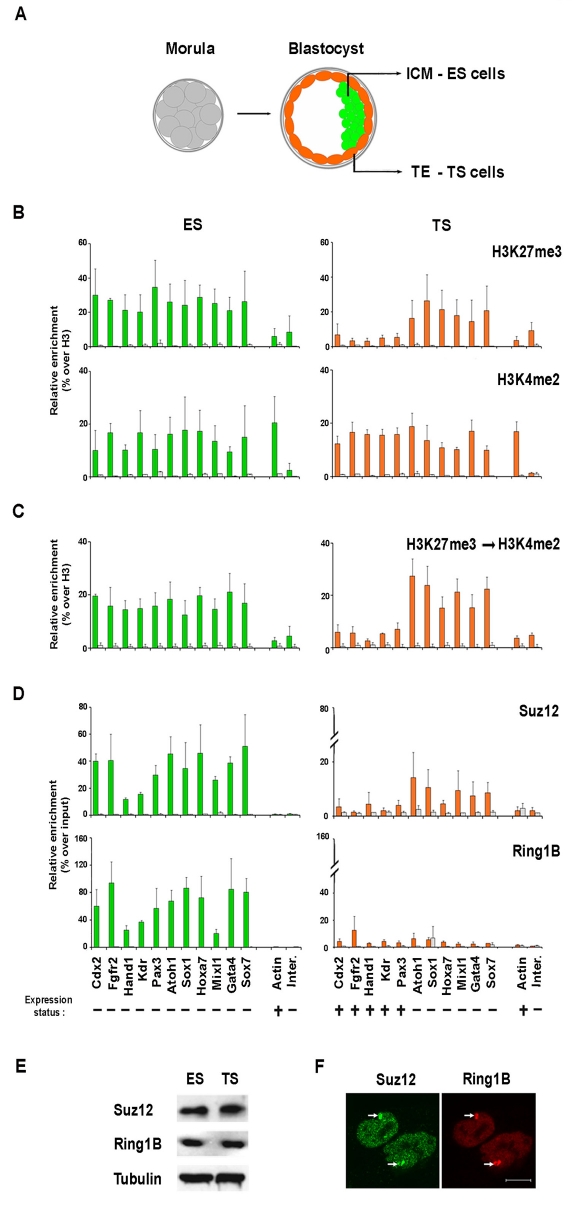
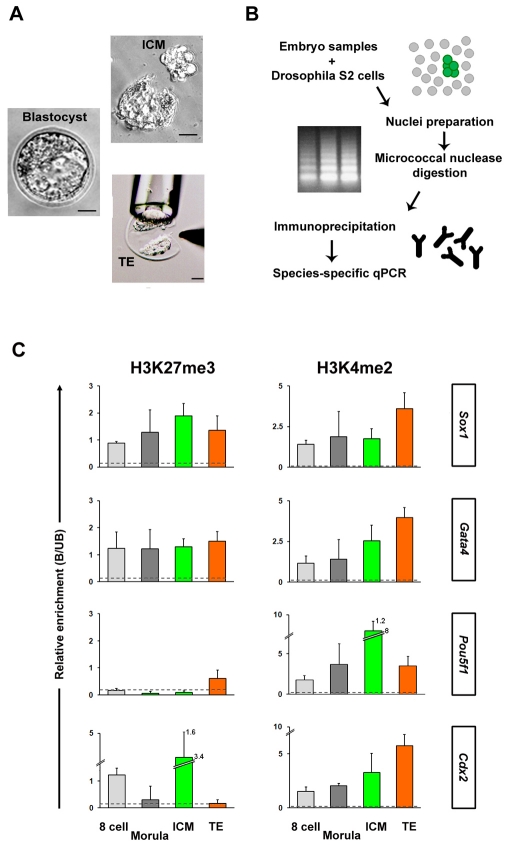
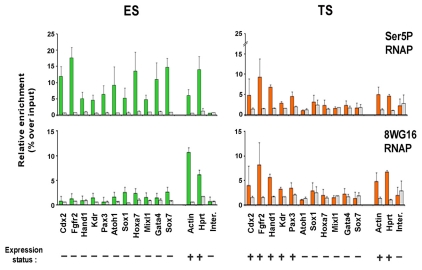
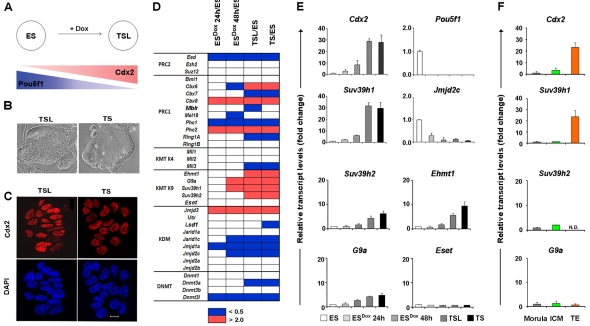
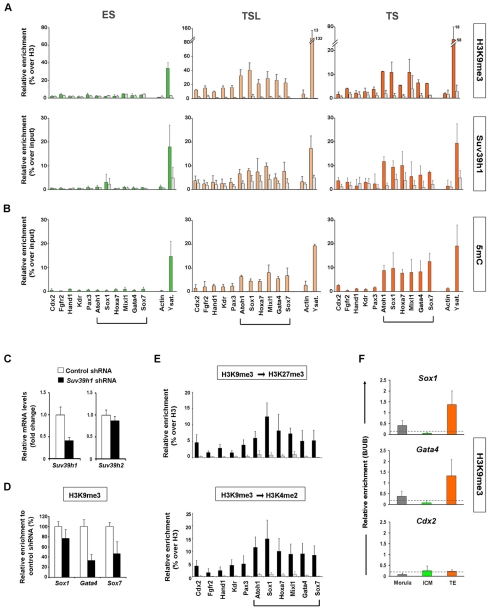
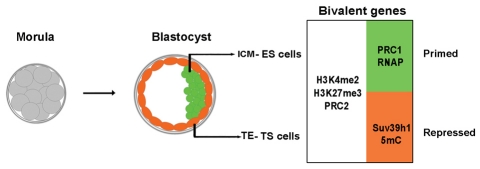
Pluripotent cells develop within the inner cell mass of blastocysts, a mosaic of cells surrounded by an extra-embryonic layer, the trophectoderm. We show that a set of somatic lineage regulators (including Hox, Gata and Sox factors) that carry bivalent chromatin enriched in H3K27me3 and H3K4me2 are selectively targeted by Suv39h1-mediated H3K9me3 and de novo DNA methylation in extra-embryonic versus embryonic (pluripotent) lineages, as assessed both in blastocyst-derived stem cells and in vivo. This stably repressed state is linked with a loss of gene priming for transcription through the exclusion of PRC1 (Ring1B) and RNA polymerase II complexes at bivalent, lineage-inappropriate genes upon trophoblast lineage commitment. Collectively, our results suggest a mutually exclusive role for Ring1B and Suv39h1 in regulating distinct chromatin states at key developmental genes and propose a novel mechanism by which lineage specification can be reinforced during early development.


Figures

Fig. 1.
Fig. 1.
Comparison of epigenetic features in blastocyst-derived stem cells. (A) Schematic of morula and blastocyst embryos, depicting lineage segregation of the inner cell mass (ICM) and trophectoderm (TE). ES and TS cells can be derived from the ICM and TE, respectively. (B) Relative enrichment of H3K27me3 and H3K4me2 at a panel of selected promoters and controls in ZHBTc4-ES (green bars) and B1-TS (orange bars) cells. Background levels (from control IgG antibodies) are shown as grey bars. (C) Sequential ChIP using anti-H3K27me3 and anti-H3K4me2 antibodies. Enrichment is expressed relative to H3. (D) Binding of PRC2 and PRC1 components Suz12 and Ring1B, respectively, was assessed by ChIP and qPCR. Enrichment is expressed relative to input. Error bars represent s.d. of three independent experiments. (E) Western blot analysis using anti-Suz12, anti-Ring1B and anti-tubulin (loading control) antibodies. (F) Immunofluorescence analysis in female B1-TS cells, showing colocalisation of Suz12 and Ring1B on inactive X chromosomes (white arrows). Scale bar: 10 μm.
Fig. 2.
Fig. 2.
In vivo analysis of bivalent domains at selected promoters in early mouse embryos prior to and after blastocyst lineage segregation. (A) Typical early-stage blastocyst selected for these experiments. ICM samples were isolated by immunosurgery based on selective, complement-induced lysis of trophoblast cells, which can then be washed away to leave a relatively pure ICM preparation. Mural TE samples were prepared by manual dissection; blastocysts were retained by a holding pipette and part of TE cut away to ensure no contamination with ICM. (B) Diagrammatic summary of the carrier ChIP (C-ChiP) protocol. (C) Quantification by C-ChIP of H3K27me3 and H3K4me2 levels (bound/unbound ratios) at the promoters of Sox1, Gata4, Pou5f1 and Cdx2 in eight-cell (light grey), compacted morula (grey), ICM (green) and TE (orange). Antibody-bound and unbound chromatin fractions were amplified in parallel by qPCR using the same quantity of DNA. Unspecific precipitation was monitored by control IgG antibodies; background levels are denoted by dotted lines. Error bars represent s.d. of three independent experiments.
Fig. 3.
Fig. 3.
RNA polymerase II occupancy and conformation at bivalent genes in ES and TS cells. Abundance of Ser5-phosphorylated (Ser5P) or hypophosphorylated (8WG16) RNAP at bivalent, active promoters, and intergenic control, in ZHBTc4-ES (green bars) and B1-TS (orange bars) cells. Background levels (from control antibodies) are shown as grey bars. Enrichment was assessed by ChIP and qPCR and is expressed relative to input. Error bars represent s.d. of three independent experiments.
Fig. 4.
Fig. 4.
Developmentally regulated changes in gene expression profiles of chromatin regulators upon Pou5f1 repression and TS-like cell derivation. (A) Schematic of Pou5f1 shutdown and Cdx2 activation induced upon Doxycyline (Dox) treatment of ZHBTc4-ES cells. Differentiation into TS-like (TSL) cells was accomplished by culture on inactivated primary embryonic fibroblasts and in the presence of FGF4 and heparin. (B) Light microscope images comparing the morphology of ZHBTc4-derived TS-like (TSL) and B1-TS (TS) colonies. (C) Immunofluorescence analysis showing homogenous expression of the TS-associated marker Cdx2 in TSL and TS cells. Note that no Cdx2 signal was detected in untreated ZHBTc4-ES cells, as expected (data not shown). (D) The expression of selected chromatin regulators was compared in ZHBTc4-ES cells after 24 and 48 hours of Dox treatment (ESDox) in the presence of LIF, and in ZHBTc4-derived TSL (TSL) cells and B1-TS (TS) cells, using quantitative RT-PCR (qRT-PCR). Values shown are normalised to actin and L19 and are expressed relative to untreated ZHBTc4-ES cells (ES=1). Upregulation (mean±s.d.>2) and downregulation (mean±s.d.<0.5) are coloured in red and blue, respectively. (E) Histograms showing the expression pattern of Cdx2, Pou5f1, Suv39h1, Jmjd2c, Suv39h2, Ehmt1, G9a and Eset upon Pou5f1 shutdown and TSL cell derivation. Error bars represent s.d. of three independent experiments. (F) Expression levels of Cdx2, Suv39h1, Suv39h2 and G9a, as assessed by qRT-PCR, in morula (grey), dissected ICM (green) and TE (orange) sample preparations. Values shown are normalised to S17 and L19 mRNA levels and are expressed relative to morula samples (morula=1). Error bars represent s.d. of three independent experiments. Note that Ehmt1 and Eset transcript levels were below detection in all three samples under the same experimental conditions (data not shown). N.D., not detectable.
Fig. 5.
Fig. 5.
Bivalent genes are targeted by Suv39h1-mediated H3K9me3 upon trophectoderm lineage commitment in vitro and in vivo. (A,B) The abundance of H3K9me3 and Suv39h1 was assessed by ChIP (A) and DNA methylation (5mC) by MeDIP (B) at candidate gene promoters and controls in ZHBTc4-ES (green; ES), ZHBTc4-derived TS-like (light orange; TSL) and B1-TS (orange; TS) cells. Background levels (from control antibodies) are shown as grey bars. Genes that remain inactive and bivalently marked in TSL and TS cells are highlighted. Enrichment is expressed relative to H3 or input. Error bars represent s.d. of three independent experiments. (C) Expression levels of Suv39h1 and Suv39h2, as assessed by qRT-PCR, in TS cells after knockdown using Suv39h1 shRNA construct. Values shown are normalised to S17 and L19 mRNA levels and are expressed relative to control TS cells. Error bars represent s.d. of three independent experiments. (D) Quantification by C-ChIP and qPCR of H3K9me3 levels at the promoters of Sox1, Gata4 and Sox7 in Suv39h1-knockdown TS cells relative to control cells after normalising against their respective unbound fractions and IgG controls. Error bars represent s.d. of three independent experiments. (E) Sequential ChIP using anti-H3K9me3 and anti-H3K27me3 (upper panel), or anti-H3K9me3 and anti-H3K4me2 (bottom panel) antibodies in B1-TS cells. Enrichment is expressed relative to H3. Error bars represent s.d. of three independent experiments. (F) Quantification by C-ChIP and qPCR of H3K9me3 levels at the promoters of Sox1, Gata4 and Cdx2 in compacted morula (grey), ICM (green) and TE (orange). Unspecific precipitation was monitored by control IgG antibodies; background levels are denoted by dotted lines. Error bars represent s.d. of three independent experiments.
Fig. 6.
Fig. 6.
Model for the establishment of distinct chromatin states at bivalent genes in vivo upon blastocyst lineage segregation. RNA polymerase II (RNAP) and Ring1B (PRC1) depletion at Suz12 (PRC2)-bound bivalent (H3K4me2 and H3K27me3) loci is associated with the acquisition of an extra-embryonic fate and transcriptional repression by Suv39h1-mediated H3K9me3 and DNA methylation (5mC).

References

    1. Arney K. L., Bao S., Bannister A. J., Kouzarides T., Surani M. A. (2002). Histone methylation defines epigenetic asymmetry in the mouse zygote. Int. J. Dev. Biol. 46, 317-320 - PubMed
    1. Atsuta T., Fujimura S., Moriya H., Vidal M., Akasaka T., Koseki H. (2001). Production of monoclonal antibodies against mammalian Ring1B proteins. Hybridoma 20, 43-46 - PubMed
    1. Azuara V., Perry P., Sauer S., Spivakov M., Jorgensen H. F., John R. M., Gouti M., Casanova M., Warnes G., Merkenschlager M., et al. (2006). Chromatin signatures of pluripotent cell lines. Nat. Cell Biol. 8, 532-538 - PubMed
    1. Bantignies F., Cavalli G. (2006). Cellular memory and dynamic regulation of polycomb group proteins. Curr. Opin. Cell Biol. 18, 275-283 - PubMed
    1. Barski A., Cuddapah S., Cui K., Roh T. Y., Schones D. E., Wang Z., Wei G., Chepelev I., Zhao K. (2007). High-resolution profiling of histone methylations in the human genome. Cell 129, 823-837 - PubMed

Publication types

MeSH terms