. 2010 Sep;84(17):8903-12.
doi: 10.1128/JVI.00851-10. Epub 2010 Jun 23.

Alpha interferon and not gamma interferon inhibits salmonid alphavirus subtype 3 replication in vitro

Affiliations

Alpha interferon and not gamma interferon inhibits salmonid alphavirus subtype 3 replication in vitro

Cheng Xu et al. J Virol. 2010 Sep.

Abstract

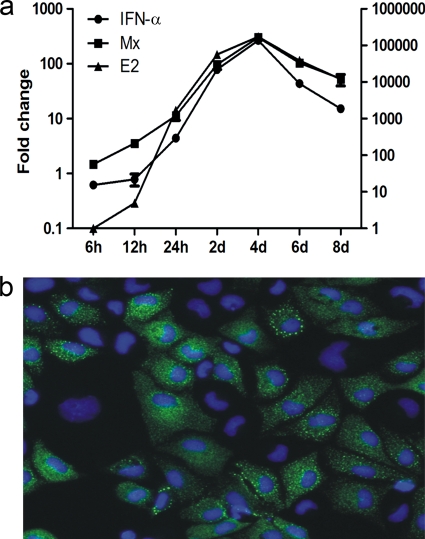
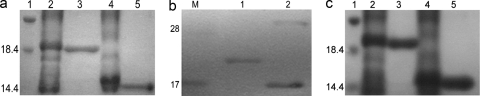
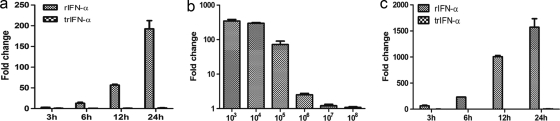
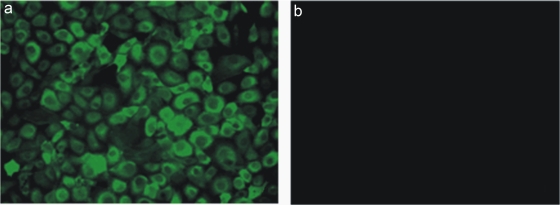
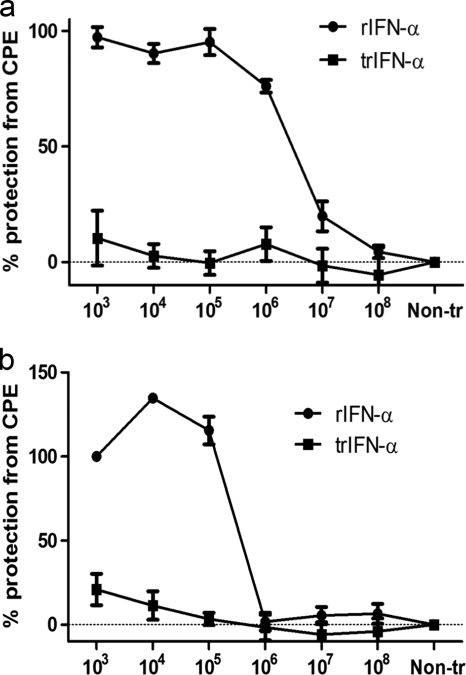
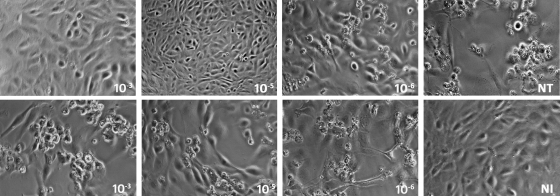
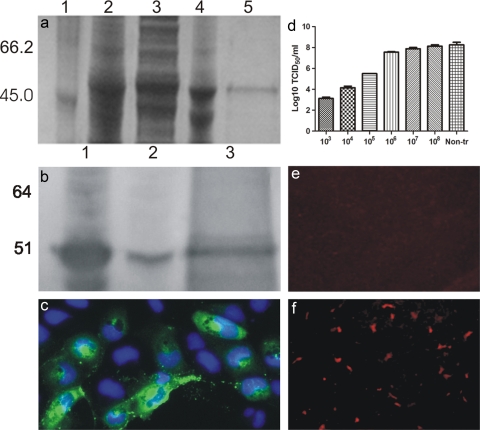
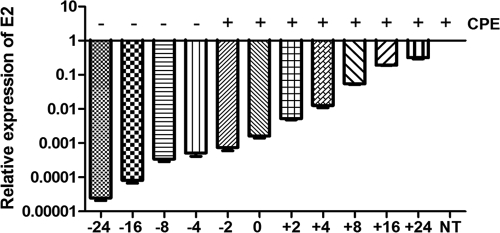
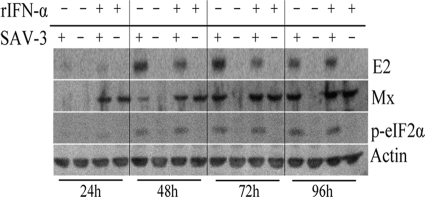
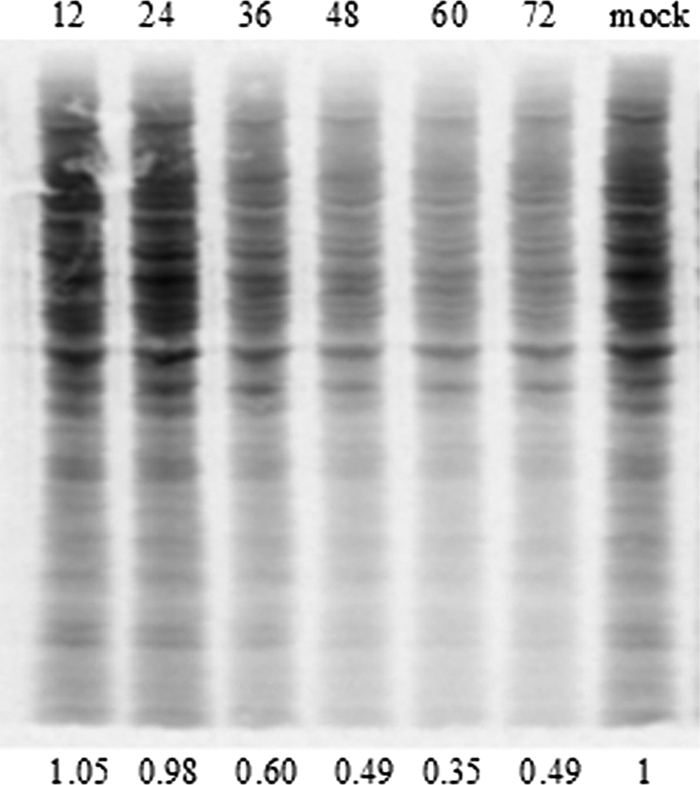
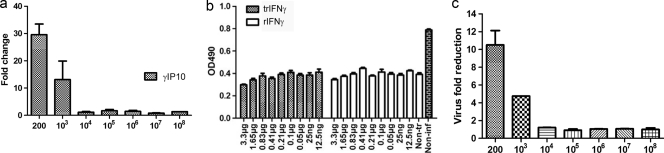
Salmonid alphavirus (SAV) is an emerging virus in salmonid aquaculture, with SAV-3 being the only subtype found in Norway. Until now, there has been little focus on the alpha interferon (IFN-alpha)-induced antiviral responses during virus infection in vivo or in vitro in fish. The possible involvement of IFN-gamma in the response to SAV-3 is also not known. In this study, the two IFNs were cloned and expressed as recombinant proteins (recombinant IFN-alpha [rIFN-alpha] and rIFN-gamma) and used for in vitro studies. SAV-3 infection in a permissive salmon cell line (TO cells) results in IFN-alpha and IFN-stimulated gene (ISG) mRNA upregulation. Preinfection treatment (4 to 24 h prior to infection) with salmon rIFN-alpha induces an antiviral state that inhibits the replication of SAV-3 and protects the cells against virus-induced cytopathic effects (CPE). The antiviral state coincides with a strong expression of Mx and ISG15 mRNA and Mx protein expression. When rIFN-alpha is administered at the time of infection and up to 24 h postinfection, virus replication is not inhibited, and cells are not protected against virus-induced CPE. By 40 h postinfection, the alpha subunit of eukaryotic initiation factor 2 (eIF2alpha) is phosphorylated concomitant with the expression of the E2 protein as assessed by Western blotting. Postinfection treatment with rIFN-alpha results in a moderate reduction in E2 expression levels in accordance with a moderate downregulation of cellular protein synthesis, an approximately 65% reduction by 60 h postinfection. rIFN-gamma has only a minor inhibitory effect on SAV-3 replication in vitro. SAV-3 is sensitive to the preinfection antiviral state induced by rIFN-alpha, while postinfection antiviral responses or postinfection treatment with rIFN-alpha is not able to limit viral replication.


Figures

FIG. 1.
FIG. 1.
(a) Expression levels of IFN-α, Mx, and viral E2 mRNA in TO cells infected with 1 MOI of SAV-3. The left y axis shows the fold increase of IFN-α and Mx mRNA relative to the nontreated control, and the right y axis shows the fold increase of viral E2 transcript levels relative to infected cells at 6 h. The results are expressed as means ± standard errors of the means (SEM) (n = 2). (b) Cytoplasmic Mx protein expression shown by indirect immunofluorescence in TO cells infected with SAV-3. Cells were fixed at 8 days postinfection. Nuclear staining was done with Hoechst 33324 dye.
FIG. 2.
FIG. 2.
(a) Expression and purification of mature and truncated IFN-α (SDS-PAGE). Lanes: 1, protein marker; 2, full-length recombinant IFN-α (rIFN-α); 3, purified rIFN-α; 4, truncated IFN-α (trIFN-α); 5, purified trIFN-α. (b) Western blot analysis of rIFN-α (lane 1) and trIFN-α (lane 2) in bacterial lysates. The predicted molecular masses of full-length and truncated IFN-α are approximately 19.4 and 16.0 kDa, respectively (M, marker lane). (c) Expression and purification of recombinant and truncated IFN-γ. Lanes: 1, protein marker; 2, full-length IFN-γ (rIFN-γ); 3, purified rIFN-γ; 4, trIFN-γ; 5, purified trIFN-γ. The predicted molecular masses of full-length and truncated IFN-γ are approximately 19.7 and 16.3 kDa, respectively.
FIG. 3.
FIG. 3.
Induction of Mx and ISG15 expression in TO cells after treatment with full-length recombinant and truncated IFN-α. (a and b) Time course expression levels of Mx (a) and dose-dependent induction of Mx mRNA by rIFN-α (b). Purified rIFN-α was diluted serially 10-fold from 0.47 mg/ml and incubated with TO cells for 24 h. The data are expressed as the mean fold changes in gene expression ± SEM of different dilutions for the rIFN-α-treated group relative to the nontreated control group after normalization to β-actin (n = 2). (c) ISG15 mRNA transcripts of TO cells stimulated with 2.5 μg/ml rIFN-α and trIFN-α. The data are expressed as the mean fold changes in gene expression ± standard errors for the IFN-α-treated group relative to the nontreated control group after normalization to β-actin (n = 2).
FIG. 4.
FIG. 4.
(a) Detection of Mx protein expression by indirect immunofluorescence in TO cells stimulated with 2.5 μg/ml rIFN-α for 24 h and then fixed and stained. (b) Nontreated control cells.
FIG. 5.
FIG. 5.
Cytopathic effect (CPE) reduction assay expressed as percent protection from CPE in TO cells (a) and in CHSE cells (b). Cell cultures were stimulated with 10-fold serial dilutions of rIFN-α and trIFN-α 24 h prior to infection with 1 MOI of SAV-3. The lowest concentration with a biological effect (106 dilution) corresponds to 0.47 ng/ml, while the highest concentration used (103 dilution) was 0.47 μg/ml for IFN-α. For trIFN-α, the highest concentration used was 0.48 μg/ml (n = 3) (means ± SEM). Non-tr, nontreated cultures.
FIG. 6.
FIG. 6.
Protection against CPE observed by morphology. The top row shows cells treated with rIFN-α, which showed dose-dependent protection against CPE at 103 and 105 dilutions, while initial CPE were seen at a 106 dilution. Conversely, trIFN-α did not show any protection against CPE (bottom row). Shown are representative findings for two independent experiments. NT, not treated; NI, not infected.
FIG. 7.
FIG. 7.
(a) Purification of recombinant pET14b-E2 protein analyzed by SDS-PAGE. Lanes: 1, protein marker; 2, whole bacteria after induction; 3, soluble fraction after sonication; 4, insoluble fraction after sonication; 5, purified recombinant protein. (b) Characterization of polyclonal antibody against E2 by Western blotting. Lanes: 1, pET14b-E2 after induction; 2, pET14b-E2 without induction; 3, purified E2. (c) Reactivity of rabbit antibody against E2 by IFAT of CHSE cells infected with SAV-3 using a 1:400 dilution of the serum. (d) Virus yield reduction assay. TO cells in 24-well plates were stimulated with 10-fold serial dilutions of rIFN-α for 24 h and then infected with 1 MOI of SAV-3. Cell culture supernatants were collected when strong CPE were observed for the control infected cells. The virus titer of the supernatants at 10 days postinfection was determined by the TCID50 method (n = 2) (means ± SEM). (e) Inhibition of E2 protein synthesis in interferon-treated TO cells. TO cells were treated with 0.47 μg/ml IFN-α for 24 h and subsequently infected with 1 MOI of SAV-3. At 2 days postinfection, cells were stained with anti-E2 antibody, and no cells were found to express virus protein. (f) TO cells without IFN treatment infected as described in the text and stained by IFAT for E2, showing distinct cytoplasmic staining in infected cells.
FIG. 8.
FIG. 8.
Timing of IFN-α treatment of SAV-3-infected cells. Treatment 4 to 24 h prior to infection results in a marked reduction in virus replication (2,000- to 40,000-fold reduction) as measured by real-time PCR and protection against CPE. rIFN-α treatment at the time of infection or up to 24 h postinfection gives a reduction in virus replication but not protection against CPE. TO cells were infected with an MOI of 1, and collection was done at 4 days postinfection. Shown are representative data from two independent experiments, expressed relative to the nontreated control (NT). More details are given in Materials and Methods.
FIG. 9.
FIG. 9.
Protein analysis of E2, Mx, and p-eIF2α in virus-infected cells. TO cells were infected with SAV-3 (MOI of 1) or left uninfected, and at 24, 48, 72, and 96 h postinfection, uninfected (−) and infected (+) cells were treated with 0.47 μg/ml of rIFN-α for 16 h or left untreated. Cells were lysed by using CelLytic M reagent (Sigma) and scraped from the dish. The expression of the E2, Mx, p-eIF2α, and actin proteins was detected by Western blotting.
FIG. 10.
FIG. 10.
Residual protein synthesis in TO cells infected with SAV-3. Confluent TO cells were grown in a six-well plate and infected as described in Materials and Methods. The membrane was exposed in a PhosphorImager cassette and then scanned by using a Typhoon imager. Numbers above the figure represent hours postpulsing. The protein amount was quantified by densitometry with ImageJ software as described in Materials and Methods. The results show 40, 51, and 65% reduction by 36, 48, and 60 h postinfection, respectively. Mock infection is shown at the far right.
FIG. 11.
FIG. 11.
(a) Induction of ISG mRNA by rIFN-γ in TO cells. Purified rIFN-γ was serially diluted from 0.33 mg/ml in cell medium and incubated with TO cells for 24 h. The data are expressed as the mean fold changes in gene expression ± standard errors of different dilutions of the IFN-γ-treated group relative to the nontreated control group after normalization to β-actin (n = 2) (±SEM). (b) Cytopathic effect reduction assay of IFN-γ-treated TO cells infected with SAV-3. TO cells were stimulated with serial dilutions of rIFN-γ and trIFN-γ for 24 h and subsequently infected with 1 MOI of SAV-3. There is no significant difference in protection against CPE between cell cultures pretreated with rIFN-γ and trIFN-γ (n = 4) (±SEM). Non-tr, nontreated cells; Non-inf, noninfected; OD490, optical density at 490 nm. (c) Real-time PCR quantification of virus in cell supernatants from TO cells stimulated with serial dilutions of mature IFN-γ for 24 h and subsequently infected with 1 MOI of SAV-3. Cell supernatants were collected when a strong CPE was observed in the control infected cells (8 days postinfection). The data are expressed as the mean crossing-point values ± standard errors using real-time PCR of different dilutions of an IFN-γ-treated group relative to the nontreated infected control group (n = 2) (±SEM).

Similar articles

Cited by

References

    1. Aguilar, P. V., S. Paessler, A. S. Carrara, S. Baron, J. Poast, E. Wang, A. C. Moncayo, M. Anishchenko, D. Watts, R. B. Tesh, and S. C. Weaver. 2005. Variation in interferon sensitivity and induction among strains of eastern equine encephalitis virus. J. Virol. 79:11300-11310. - PMC - PubMed
    1. Aguilar, P. C., S. C. Weaver, and C. F. Basler. 2007. Capsid protein of eastern encephalitis virus inhibits host cell gene expression. J. Virol. 81:3866-3876. - PMC - PubMed
    1. Berg, T. S. K., B. Sun, and B. Robertsen. 2009. An antiserum against Atlantic salmon IFNa1 detects IFN and neutralizes antiviral activity produced by poly I:C stimulated cells. Dev. Comp. Immunol. 33:638-645. - PubMed
    1. Bergan, V., R. Jagus, S. Lauksund, O. Kileng, and B. Robertsen. 2008. The Atlantic salmon Z-DNA binding protein kinase phosphorylates translation initiation factor 2 alpha and constitutes a unique orthologue to the mammalian dsRNA-activated protein kinase R. FEBS J. 275:184-197. - PubMed
    1. Brehin, A. C., I. Casademont, M. P. Frenkiel, C. Julier, A. Sakuntabhai, and P. Despres. 2009. The large form of human 2′,5′-oligoadenylate synthetase (OAS3) exerts antiviral effect against Chikungunya virus. Virology 384:216-222. - PubMed

Publication types

MeSH terms

LinkOut - more resources