

Association of the influenza virus RNA polymerase subunit PB2 with the host chaperonin CCT
- PMID: 20573828
- PMCID: PMC2919027
- DOI: 10.1128/JVI.00813-10
Association of the influenza virus RNA polymerase subunit PB2 with the host chaperonin CCT
Abstract
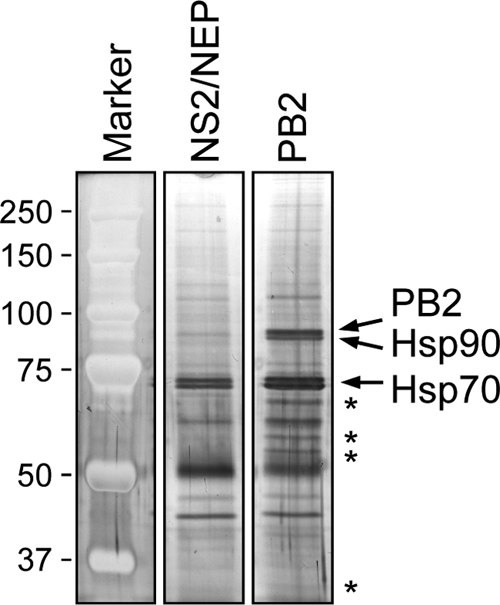
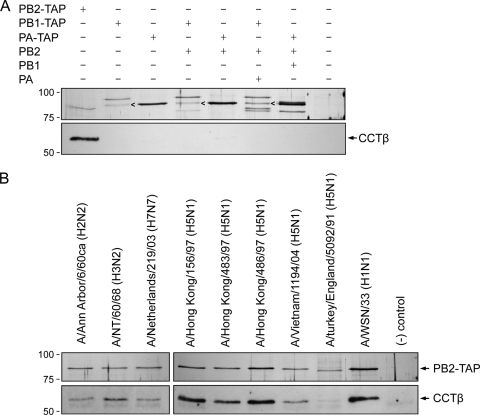
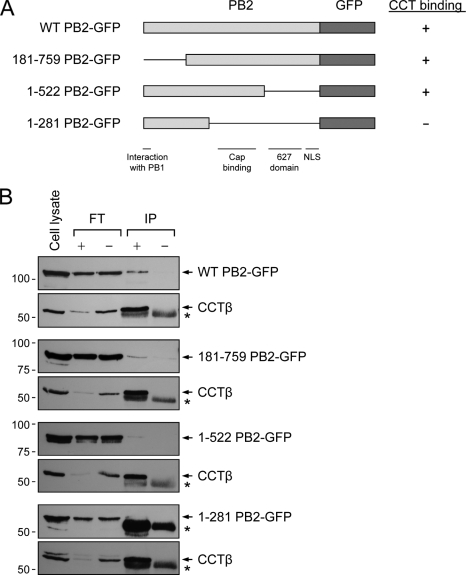
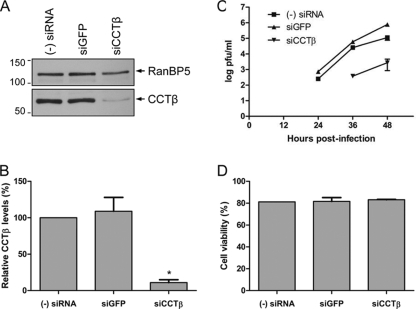
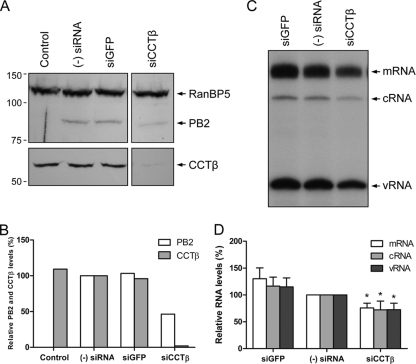
The RNA polymerase of influenza A virus is a host range determinant and virulence factor. In particular, the PB2 subunit of the RNA polymerase has been implicated as a crucial factor that affects cell tropism as well as virulence in animal models. These findings suggest that host factors associating with the PB2 protein may play an important role during viral replication. In order to identify host factors that associate with the PB2 protein, we purified recombinant PB2 from transiently transfected mammalian cells and identified copurifying host proteins by mass spectrometry. We found that the PB2 protein associates with the cytosolic chaperonin containing TCP-1 (CCT), stress-induced phosphoprotein 1 (STIP1), FK506 binding protein 5 (FKBP5), alpha- and beta-tubulin, Hsp60, and mitochondrial protein p32. Some of these binding partners associate with each other, suggesting that PB2 might interact with these proteins in multimeric complexes. More detailed analysis of the interaction of the PB2 protein with CCT revealed that PB2 associates with CCT as a monomer and that the CCT binding site is located in a central region of the PB2 protein. PB2 proteins from various influenza virus subtypes and origins can associate with CCT. Silencing of CCT resulted in reduced viral replication and reduced PB2 protein and viral RNA accumulation in a ribonucleoprotein reconstitution assay, suggesting an important function for CCT during the influenza virus life cycle. We propose that CCT might be acting as a chaperone for PB2 to aid its folding and possibly its incorporation into the trimeric RNA polymerase complex.
Figures
Similar articles
-
The PB2 subunit of the influenza virus RNA polymerase affects virulence by interacting with the mitochondrial antiviral signaling protein and inhibiting expression of beta interferon.J Virol. 2010 Sep;84(17):8433-45. doi: 10.1128/JVI.00879-10. Epub 2010 Jun 10. J Virol. 2010. PMID: 20538852 Free PMC article.
-
Generation of recombinant influenza virus bearing strep tagged PB2 and effective identification of interactional host factors.Vet Microbiol. 2021 Mar;254:108985. doi: 10.1016/j.vetmic.2021.108985. Epub 2021 Jan 13. Vet Microbiol. 2021. PMID: 33550110
-
Characterization of the interaction between the influenza A virus polymerase subunit PB1 and the host nuclear import factor Ran-binding protein 5.J Gen Virol. 2011 Aug;92(Pt 8):1859-1869. doi: 10.1099/vir.0.032813-0. Epub 2011 May 11. J Gen Virol. 2011. PMID: 21562121
-
[Structural and Biochemical Analyses on the RNA-dependent RNA Polymerase of Influenza Virus for Development of Novel Anti-influenza Agents].Yakugaku Zasshi. 2017;137(2):205-214. doi: 10.1248/yakushi.16-00195. Yakugaku Zasshi. 2017. PMID: 28154333 Review. Japanese.
-
[Research progress in molecular determinants of neuraminidase, polymerase basic protein 2 and nonstructural protein 1, related to virulence of influenza A virus--a review].Wei Sheng Wu Xue Bao. 2011 Jan;51(1):7-13. Wei Sheng Wu Xue Bao. 2011. PMID: 21465783 Review. Chinese.
Cited by
-
Revisiting the chaperonin T-complex protein-1 ring complex in human health and disease: A proteostasis modulator and beyond.Clin Transl Med. 2024 Feb;14(2):e1592. doi: 10.1002/ctm2.1592. Clin Transl Med. 2024. PMID: 38363102 Free PMC article. Review.
-
Chaperonin TRiC/CCT Participates in Mammarenavirus Multiplication in Human Cells via Interaction with the Viral Nucleoprotein.J Virol. 2023 Feb 28;97(2):e0168822. doi: 10.1128/jvi.01688-22. Epub 2023 Jan 19. J Virol. 2023. PMID: 36656012 Free PMC article.
-
LGP2 directly interacts with flavivirus NS5 RNA-dependent RNA polymerase and downregulates its pre-elongation activities.PLoS Pathog. 2023 Sep 1;19(9):e1011620. doi: 10.1371/journal.ppat.1011620. eCollection 2023 Sep. PLoS Pathog. 2023. PMID: 37656756 Free PMC article.
-
Proteomic analysis of chicken embryo fibroblast cells infected with recombinant H5N1 avian influenza viruses with and without NS1 eIF4GI binding domain.Oncotarget. 2017 Dec 22;9(9):8350-8367. doi: 10.18632/oncotarget.23615. eCollection 2018 Feb 2. Oncotarget. 2017. PMID: 29492200 Free PMC article.
-
Interaction of CSFV E2 protein with swine host factors as detected by yeast two-hybrid system.PLoS One. 2014 Jan 8;9(1):e85324. doi: 10.1371/journal.pone.0085324. eCollection 2014. PLoS One. 2014. PMID: 24416391 Free PMC article.
References
-
- Brackley, K. I., and J. Grantham. 2010. Subunits of the chaperonin CCT interact with F-actin and influence cell shape and cytoskeletal assembly. Exp. Cell Res. 316:543-553. - PubMed
-
- Brass, A. L., I. C. Huang, Y. Benita, S. P. John, M. N. Krishnan, E. M. Feeley, B. J. Ryan, J. L. Weyer, L. van der Weyden, E. Fikrig, D. J. Adams, R. J. Xavier, M. Farzan, and S. J. Elledge. 2009. The IFITM proteins mediate cellular resistance to influenza A H1N1 virus, West Nile virus, and dengue virus. Cell 139:1243-1254. - PMC - PubMed
-
- Carr, S. M., E. Carnero, A. Garcia-Sastre, G. G. Brownlee, and E. Fodor. 2006. Characterization of a mitochondrial-targeting signal in the PB2 protein of influenza viruses. Virology 344:492-508. - PubMed
-
- Chase, G., T. Deng, E. Fodor, B. W. Leung, D. Mayer, M. Schwemmle, and G. Brownlee. 2008. Hsp90 inhibitors reduce influenza virus replication in cell culture. Virology 377:431-439. - PubMed
Publication types
MeSH terms
Substances
Grants and funding
LinkOut - more resources
Full Text Sources
Medical
Research Materials
Miscellaneous
