. 2010 Jun 23;30(25):8489-501.
doi: 10.1523/JNEUROSCI.1534-10.2010.

Efficacy loss of the anticonvulsant carbamazepine in mice lacking sodium channel beta subunits via paradoxical effects on persistent sodium currents

Affiliations

Efficacy loss of the anticonvulsant carbamazepine in mice lacking sodium channel beta subunits via paradoxical effects on persistent sodium currents

Mischa Uebachs et al. J Neurosci. .

Abstract

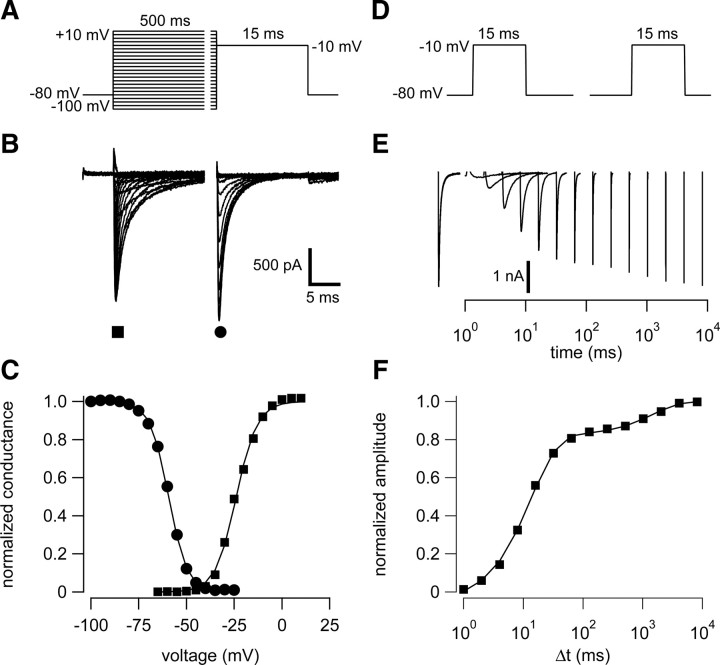
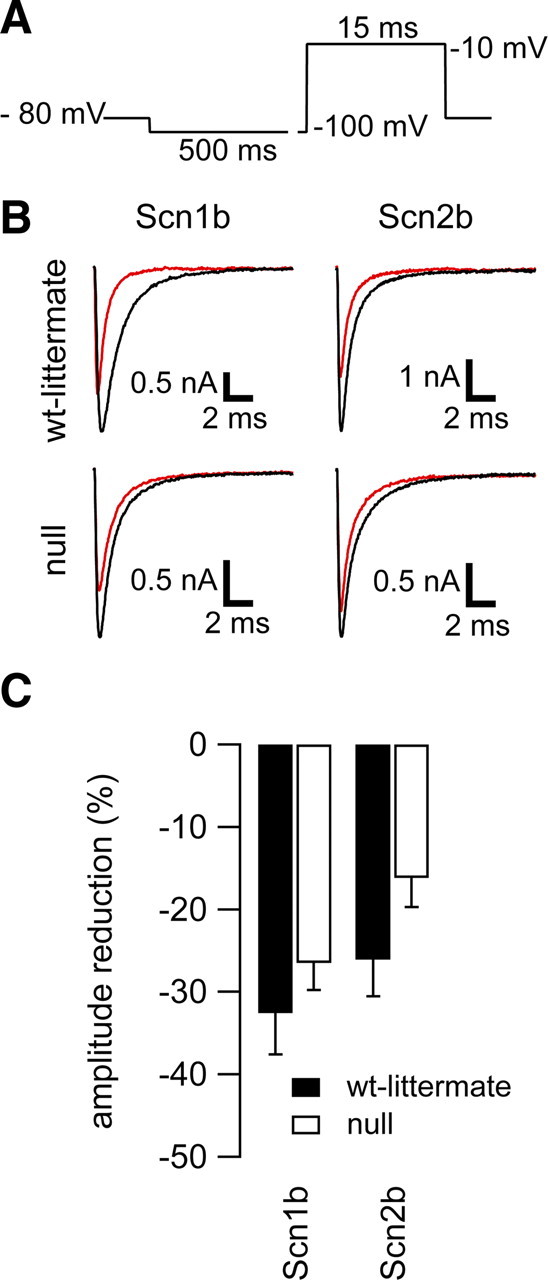
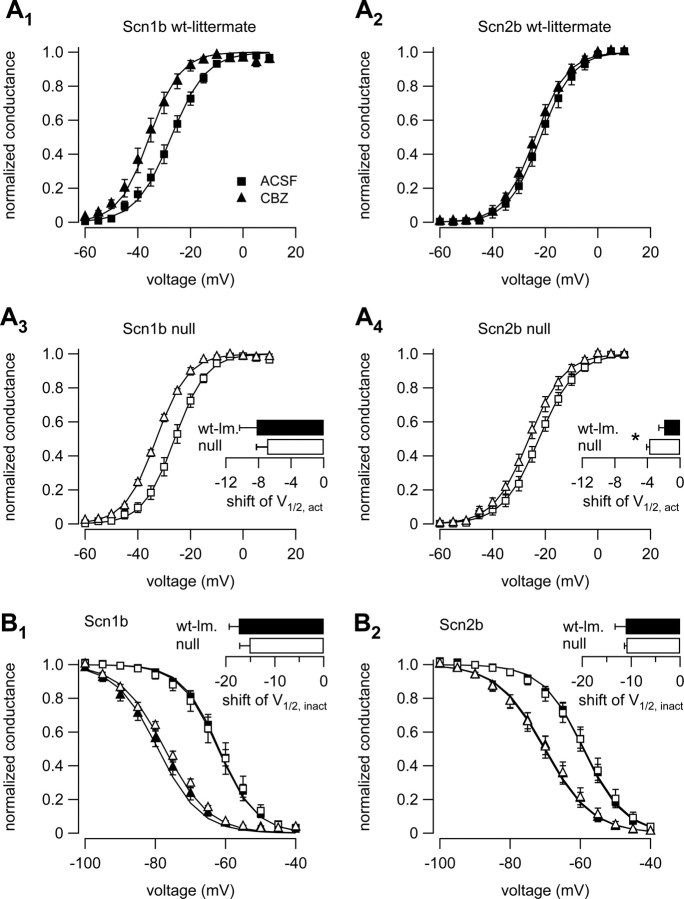
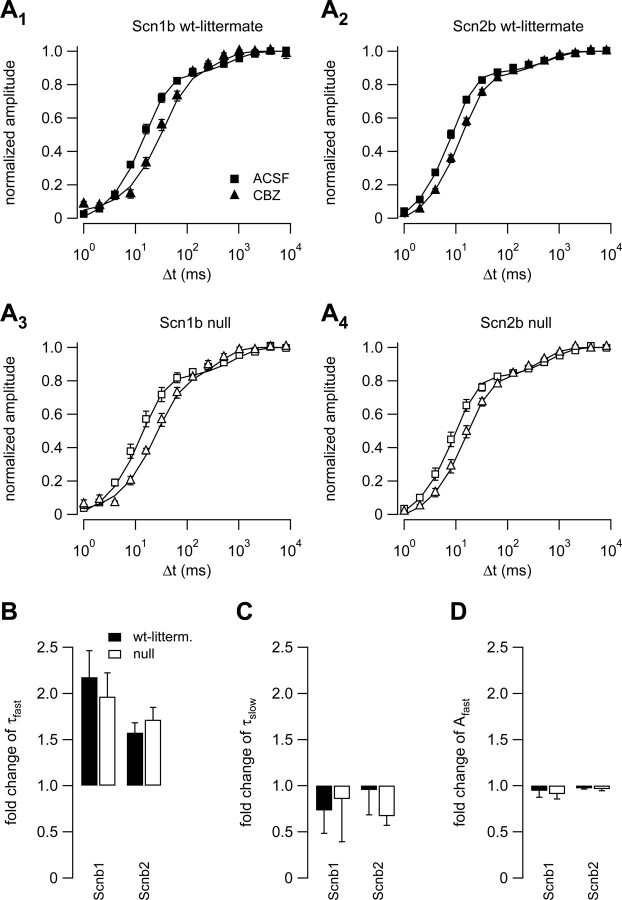
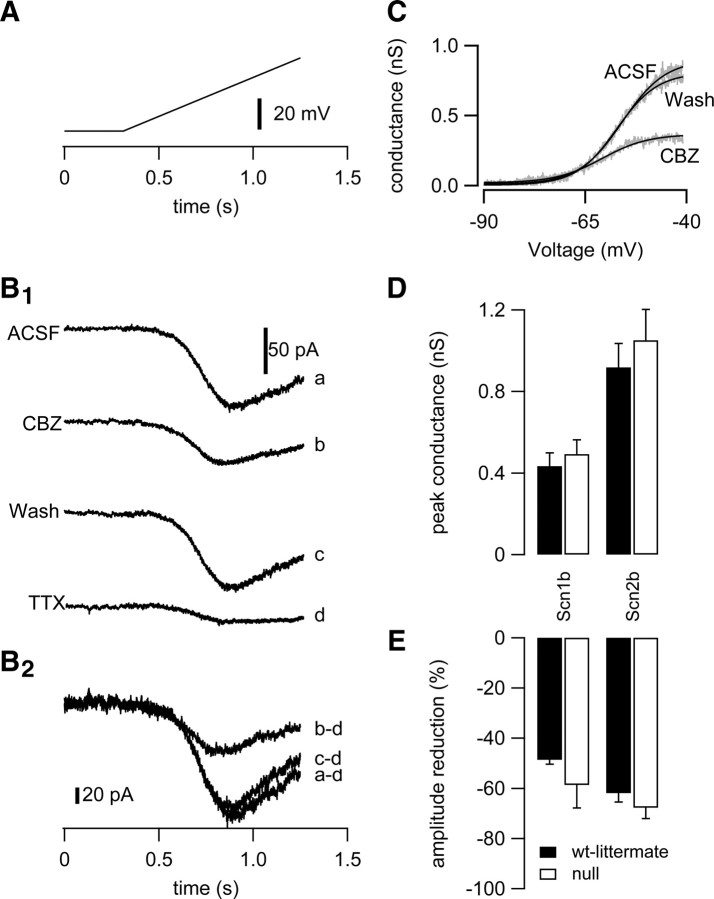
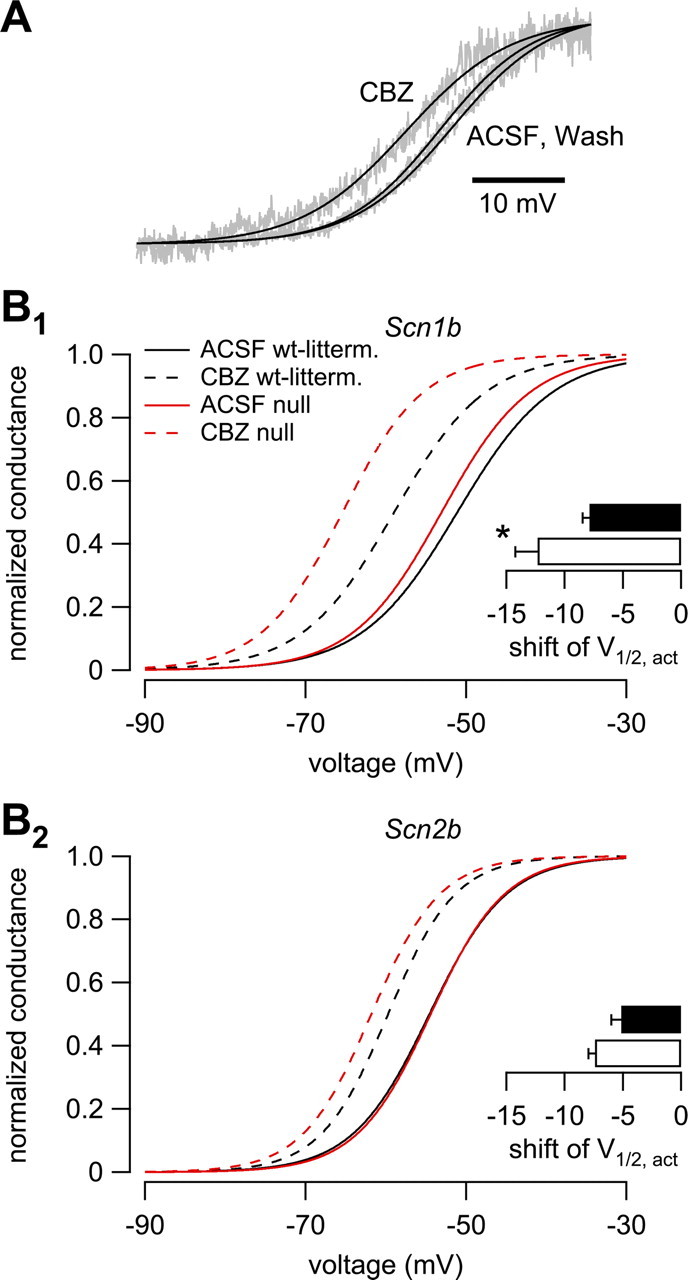
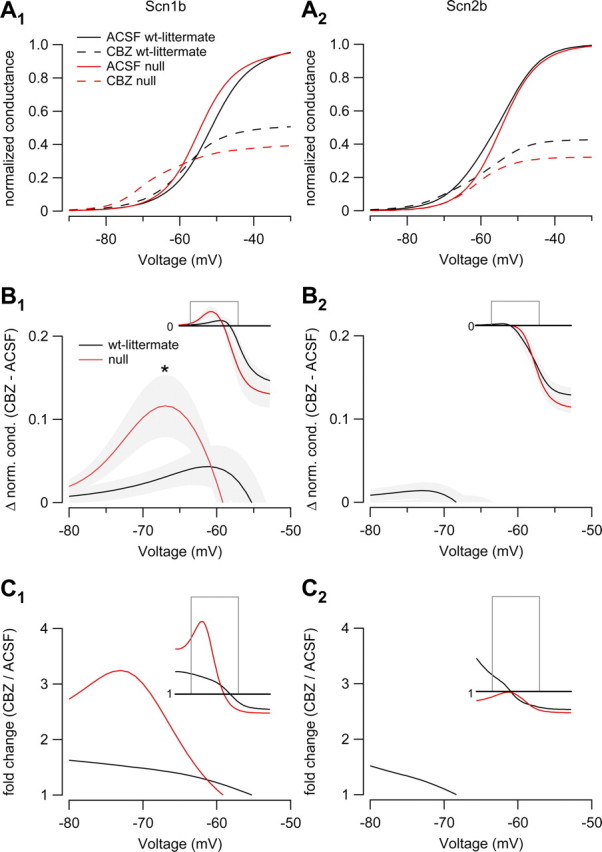
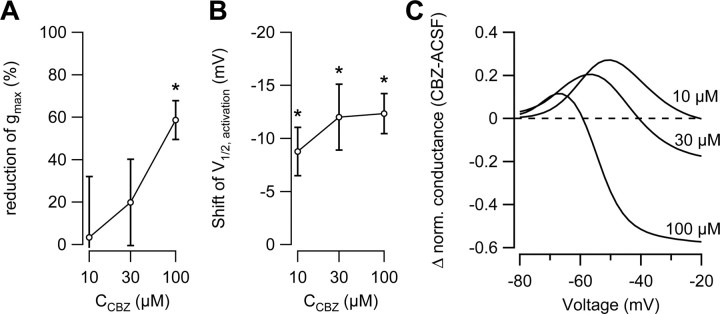
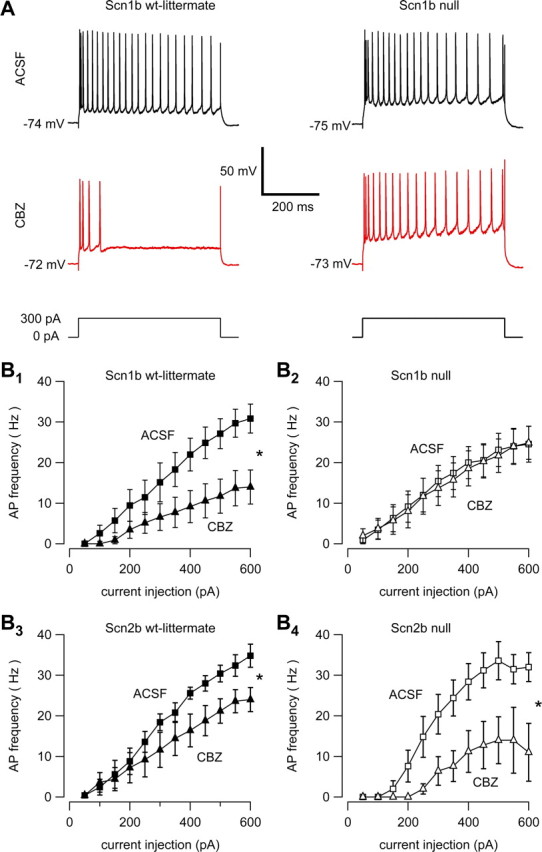
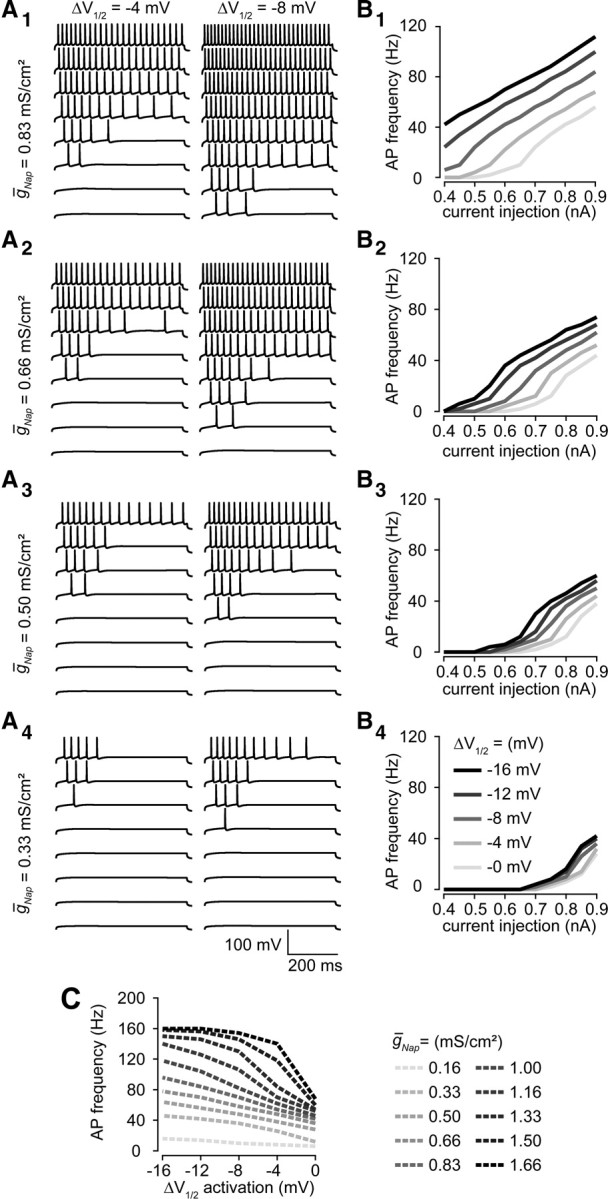
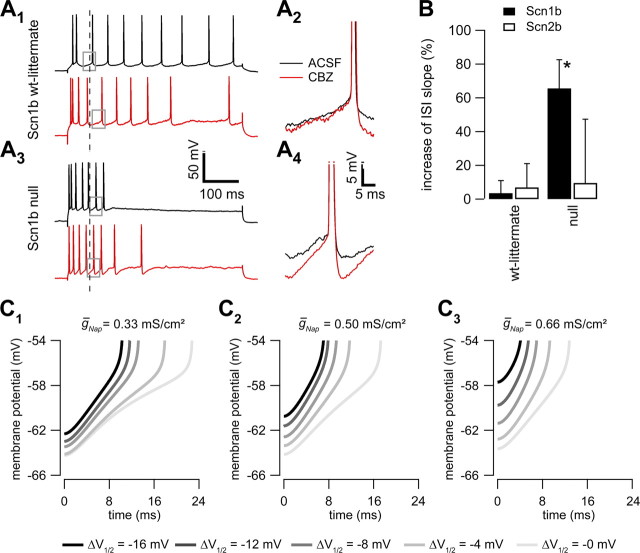
Neuronal excitability is critically determined by the properties of voltage-gated Na(+) currents. Fast transient Na(+) currents (I(NaT)) mediate the fast upstroke of action potentials, whereas low-voltage-activated persistent Na(+) currents (I(NaP)) contribute to subthreshold excitation. Na(+) channels are composed of a pore-forming alpha subunit and beta subunits, which modify the biophysical properties of alpha subunits. We have examined the idea that the presence of beta subunits also modifies the pharmacological properties of the Na(+) channel complex using mice lacking either the beta(1) (Scn1b) or beta(2) (Scn2b) subunit. Classical effects of the anticonvulsant carbamazepine (CBZ), such as the use-dependent reduction of I(NaT) and effects on I(NaT) voltage dependence of inactivation, were unaltered in mice lacking beta subunits. Surprisingly, CBZ induced a small but significant shift of the voltage dependence of activation of I(NaT) and I(NaP) to more hyperpolarized potentials. This novel CBZ effect on I(NaP) was strongly enhanced in Scn1b null mice, leading to a pronounced increase of I(NaP) within the subthreshold potential range, in particular at low CBZ concentrations of 10-30 microm. A combination of current-clamp and computational modeling studies revealed that this effect causes a complete loss of CBZ efficacy in reducing repetitive firing. Thus, beta subunits modify not only the biophysical but also the pharmacological properties of Na(+) channels, in particular with respect to I(NaP). Consequently, altered expression of beta subunits in other neurological disorders may cause altered neuronal sensitivity to drugs targeting Na(+) channels.


Figures

Figure 1.
Figure 1.
Analysis of INaT properties. A–C, Analysis of the voltage dependence of activation and inactivation in a representative neuron. A, Voltage protocol used to analyze voltage dependence of INaT, with pulses to potentials ranging from −100 mV to +10 mV (500 ms) followed by a voltage step to −10 mV (15 ms). The break in the lines indicates a gap of 485 ms. B, The initial 500 ms voltage step to different potentials caused activation of INaT (leftmost panel), allowing construction of an activation curve. The subsequent voltage step to −10 mV allowed us to assess voltage-dependent inactivation by the preceding voltage step (representative family of traces in the rightmost panel). C, The peak current amplitudes were corrected for the driving force, and the resulting normalized conductances are depicted versus the potential of the first voltage step (squares and circles indicating the currents during the first and second voltage step, respectively). The data were then fitted with a Boltzmann equation (superimposed lines). Exemplary analysis is shown for the recordings shown in B. D–F, Analysis of the time course of recovery from inactivation. D, Voltage protocol used to analyze recovery from inactivation. An initial voltage step to −10 mV (15 ms) to inactivate INaT was followed by a voltage step of varying duration Δt to −80 mV to induce recovery from inactivation. The fraction of INaT recovered from inactivation was determined with a second voltage step to −10 mV. E, Representative recording of recovery from inactivation. The leftmost traces correspond to the currents elicited by the initial step to −10 mV. The rightmost family of traces reflect INaT elicited following the various different recovery intervals Δt and are depicted on a logarithmic time scale. F, Amplitudes are normalized to the peak amplitude INaT during the initial voltage step to −10 mV. A biexponential fit is superimposed as solid line. Exemplary analysis is shown for the recordings shown in E. For the quantitative average values for all experimental groups, see Table 1.
Figure 2.
Figure 2.
CBZ reduces Na+ current amplitude, and this effect is unaltered in mice lacking either Scn1b or Scn2b. A, A voltage step to −10 mV (15 ms) was applied to elicit maximal Na+ currents. B, Representative currents before (black) and during (red) application of 100 μm CBZ are depicted for Scn1b wild-type and Scn2b wild-type (upper traces) and for Scn1b null and Scn2b null (lower traces). C, The fraction of channels blocked by CBZ was averaged for all cells. Neither loss of Scn1b [32.6 ± 5.0% vs 26.5 ± 3.3% for +/+ (n = 11) and −/− (n = 6) animals, respectively; n.s.] nor Scn2b [26.1 ± 4.4% vs 16.2 ± 3.5% for +/+ (n = 5) and −/− (n = 7) animals, respectively; n.s.] causes a significant reduction of the blocking effect of CBZ.
Figure 3.
Figure 3.
CBZ shifts the voltage dependence of activation to more hyperpolarized potentials, and this effect is enhanced in mice lacking Scn2b. A, Voltage dependence of activation was analyzed according to Figure 1A–C in the presence and absence of CBZ (triangles and squares, respectively, in all panels). A1, A2, CBZ induced a strong hyperpolarizing shift in the voltage dependence of activation in the younger Scn1b wild-type mice (P12–P20, shift in V1/2,act of −8.2 ± 2.1 mV, n = 11, A1), and a less pronounced, but still significant, effect in the adult Scn2b wild-type mice (P40–P60, shift in V1/2,act of −1.9 ± 0.6 mV, n = 6, p < 0.05, A2). A3, A4, Comparison of the genotypes revealed a significant enhancement of the CBZ-induced left shift in Scn2b null compared to Scn2b wild-type mice (shift in V1/2,act of −3.8 ± 0.3 mV in Scn2b null mice, n = 7, p < 0.05, A4). Such an enhancement was not observed for Scn1b null compared to Scn1b wild-type mice (shift in V1/2,act of −6.9 ± 1.3 mV in Scn1b null, n = 5, n.s., A3, see insets in A3 and A4). B, Analysis of the voltage dependence of inactivation (see Fig. 1A–C for protocols and example traces) revealed a strong CBZ-induced hyperpolarizing shift of the voltage dependence of inactivation independent of expression of Scn1b (−17.4 ± 2.0 mV, n = 11 and −15.2 ± 2.0 mV, n = 6, for +/+ and −/− animals, respectively, n.s., B1) and Scn2b (−11.1 ± 2.1 mV, n = 5 and −11.0 ± 0.4 mV, n = 7, for +/+ and −/− animals, respectively, n.s., B2, see insets for quantification; open symbols correspond to Scn1b or Scn2b null mice and filled symbols to their wild-type littermates).
Figure 4.
Figure 4.
Time course of recovery from inactivation is slower following CBZ application, and this effect is unaltered in mice lacking either β1 or β2 subunits. A, Analysis of the recovery behavior (see Fig. 1D–F for protocol and example traces) revealed a slower recovery from inactivation in the presence of 100 μm CBZ than in control recordings (triangles and squares, respectively, in all panels). This effect appeared to be similar in all genotypes (A1–A4). Biexponential fits are superimposed on the data points in all panels. B–D, Quantification of the biexponential fits: The effects of CBZ on τfast (B), τslow (C), and the amplitude proportion of τfast (D) were not significantly altered by genetic deletion of either Scn1b or Scn2bfast: 2.2 ± 0.3- and 2.0 ± 0.3-fold change for Scn1b wild-type (n = 10) and Scn1b null (n = 6) mice (n.s.) and 1.5 ± 0.1- and 1.7 ± 0.1-fold change for Scn2b wild-type (n = 8) and Scn2b null (n = 6) mice (n.s.), respectively].
Figure 5.
Figure 5.
CBZ reduces the amplitude of INaP independent of the β subunit expression. A, INaP was elicited by a slow voltage ramp (50 mV/s). B1, Representative current traces before (trace a), during (trace b), and after (trace c) washout of 100 μm CBZ, and following TTX application (trace d), are shown. B2, Currents obtained during TTX application are subtracted from all other traces, to isolate INaP. C, Currents were corrected for the driving force and the resulting conductance plotted versus the voltage. The voltage dependence of activation was fitted with a Boltzmann equation (superimposed black lines). D, Maximal conductances were averaged. Scn1b wild-type mice displayed a smaller conductance for INaP (0.43 ± 0.01 nS, n = 7) than Scn2b wild-type mice (0.89 ± 0.11 nS, n = 10, p < 0.05). Comparison of null mice (open bars) to their wild-type littermates (filled bars) revealed no genotype-dependent difference in INaP amplitude (0.49 ± 0.07 nS, n = 6 and 1.00 ± 0.16 nS, n = 9 for Scn1b null and Scn2b null mice, respectively). E, The amplitude reduction following CBZ application was similar [48.1 ± 1.8% and 58.6 ± 9.2% reduction for Scn1b wild-type littermates and Scn1b null mice (n.s.) and 61.9 ± 3.5% and 67.7 ± 4.3% reduction for Scn2b wild-type littermates and Scn2b null mice (n.s.), respectively] in all experimental groups (filled and open bars for wild-type and null animals, respectively).
Figure 6.
Figure 6.
CBZ shifts the voltage dependence of INaP to more hyperpolarized potentials, and this effect is strongly augmented by genetic deletion of Scn1b. A, To visualize the voltage dependence of activation, the conductance was normalized to the maximal conductance of INaP during the voltage ramp. This analysis reveals a pronounced left shift induced by CBZ. B, Activation curves calculated from the average fit parameters of all cells are depicted before (solid lines) and during (dashed lines) CBZ application for wild-type (black lines) and β subunit null (red lines) mice. Deletion of Scn1b (B1) but not Scn2b (B2) resulted in an increased CBZ effect [−12.3 ± 1.9 mV compared to −7.9 ± 0.6 mV shift for Scn1b null (n = 6) and Scn1b wild-type (n = 7) mice (p < 0.05) and −6.0 ± 0.6 mV compared to −4.3 ± 0.5 mV shift for Scn2b null (n = 9) and Scn2b wild-type (n = 10) mice (not significant), respectively] on the voltage dependence of activation (see insets).
Figure 7.
Figure 7.
The hyperpolarizing shift of the voltage dependence of activation causes paradoxical effects of CBZ on INaP in Scn1b null mice. A, To demonstrate the net change in conductance resulting from the reduction in maximal amplitude (Fig. 5E) versus the shift in the voltage dependence (Fig. 6B1,B2), INaP conductance was normalized to the maximal conductance in the absence of CBZ. Activation curves calculated from the average fit parameters of all cells are depicted before (solid lines) and during (dashed lines) CBZ application for wild-type (black lines) and Scn1b (A1) or Scn2b (A2) null mice (red lines). This reveals an increase of conductance in the subthreshold range following application of CBZ in Scn1b null mice. B, The difference in the normalized conductance before and during application of CBZ was calculated to quantify the potentiating effects of CBZ at subthreshold voltages. The increase of INaP conductance induced by CBZ was significantly augmented (B1, n = 6, p < 0.05 in the range −73 to −67 mV) in the Scn1b null mice compared to wild-type mice (n = 7, see inset for full range; gray area indicates ±SEM for each data point; gray rectangle indicates the magnified range; note that the red trace does not lie within the magnified range and therefore is not depicted in B2 and C2 but is present in the insets) but not in Scn2b null mice (n = 9) compared to their wild-type littermates (n = 10, B2). C, The CBZ-induced increase of INaP conductance was normalized to the conductance in the absence of CBZ. This reveals a more than threefold augmentation of INaP conductance in the Scn1b null mice (C1; see inset for full range; gray rectangle indicates the magnified range).
Figure 8.
Figure 8.
Concentration dependence of the paradoxical effect of CBZ in Scn1b null mice. Recordings identical to those described in Figure 5 were obtained before and during application of 10–100 μm CBZ. A, Reduction of the maximal INaP conductance following application of 10, 30, or 100 μm CBZ. B, Shift of the voltage dependence of activation induced by 10–100 μm CBZ. C, The CBZ effect expressed as fraction of the maximal conductance under control conditions (see Fig. 7) revealed larger paradoxical effects with lower concentrations of CBZ, compared to 100 μm CBZ.
Figure 9.
Figure 9.
Paradoxical CBZ-induced upregulation of INaP and effects on neuronal excitability. A, Current-clamp recordings from CA1 pyramidal neurons of Scn1b null (right panels) and littermate wild-type mice (left panels). Repetitive firing was elicited by prolonged (500 ms) current injections as indicated in ACSF (black voltage traces) and following washin of 100 μm CBZ (red voltage traces). B, Spike gain, depicted by plotting the mean firing rates versus the magnitude of the current injection steps. Analyses are shown for Scn1b null mice (n = 7, B2) and their littermate controls (n = 7, B1), as well as for Scn2b null mice (n = 5, B4) and littermate controls (n = 5, B3). The gain in the presence of CBZ (triangles) is compared to the gain in ACSF (squares) in all panels, revealing a significant reduction of the gain following application of CBZ in all experimental groups (p < 0.05, indicated by asterisks) except for the Scn1b null mice, where the effect of CBZ was completely abolished.
Figure 10.
Figure 10.
Computational model—effects of varying maximal INaP conductance and voltage of half-maximal activation. A, Examples of somatic current injections of increasing amplitude (500 ms steps of 0.4 to 0.75 nA from lowermost to uppermost traces in all panels) for different maximal INaP conductances (A1–A4) and voltages of half-maximal activation of INaPV1/2 indicating relative shift of the V1/2 of activation vs a value of −52.3 mV). B, Gain plots of action potential frequencies versus the magnitude of the current injection step for the four different INaP maximal conductances (B1–B4) depicted in A. Darker grayscales indicate larger ΔV1/2, i.e., more hyperpolarized INaP voltage dependence of activation (see inset in B4). C, Interrelation of ΔV1/2 and INaP conductance for an 800 pA current injection step for a larger range of values. Different maximal INaP conductances are indicated as hatched lines with different grayscales as indicated in the legend.
Figure 11.
Figure 11.
Effects of CBZ in the subthreshold voltage range during repetitive firing. A, Black traces were obtained in ACSF, while red traces were obtained following washin of CBZ. CBZ augments the rate of interspike depolarization in Scn1b null mice. (Fig. 10A3; larger magnifications of the area indicated by the gray boxes are superimposed in A4), but not in Scn1b wild-type mice (Fig. 10A1, larger magnification in A2). B, Quantification of the slope of the interspike depolarization (see Materials and Methods). The relative changes of the slope following application of 100 μm CBZ compared to the slope in ACSF are depicted. Lack of β1 (rightmost filled bar, n = 7, p < 0.01, indicated by asterisk) but not β2 (rightmost open bar, n = 3, n.s.) subunits results in a CBZ-induced acceleration of the depolarization during the interspike interval that was not observed in the wild-type littermate controls (leftmost bars, n = 5 for both groups, n.s.). C, The slope of the interspike depolarization following a simulated current injection of 800 pA is steeper with more hyperpolarized voltage of half-maximal activation (V1/2,act, darker grayscales indicate more hyperpolarized voltages). This holds true for different maximal INaP conductances (C1–C3). Zero point of the time axis in C is defined as the most hyperpolarized point of the voltage trace during the interspike interval.

Similar articles

Cited by

References

    1. Brackenbury WJ, Isom LL. Voltage-gated Na+ channels: potential for beta subunits as therapeutic targets. Expert Opin Ther Targets. 2008;12:1191–1203. - PMC - PubMed
    1. Brackenbury WJ, Calhoun JD, Chen C, Miyazaki H, Nukina N, Oyama F, Ranscht B, Isom LL. Functional reciprocity between Na+ channel Nav1.6 and beta1 subunits in the coordinated regulation of excitability and neurite outgrowth. Proc Natl Acad Sci U S A. 2010;107:2283–2288. - PMC - PubMed
    1. Catterall WA. Molecular properties of brain sodium channels: an important target for anticonvulsant drugs. Adv Neurol. 1999;79:441–456. - PubMed
    1. Chen C, Bharucha V, Chen Y, Westenbroek RE, Brown A, Malhotra JD, Jones D, Avery C, Gillespie PJ, 3rd, Kazen-Gillespie KA, Kazarinova-Noyes K, Shrager P, Saunders TL, Macdonald RL, Ransom BR, Scheuer T, Catterall WA, Isom LL. Reduced sodium channel density, altered voltage dependence of inactivation, and increased susceptibility to seizures in mice lacking sodium channel beta 2-subunits. Proc Natl Acad Sci U S A. 2002;99:17072–17077. - PMC - PubMed
    1. Chen C, Westenbroek RE, Xu X, Edwards CA, Sorenson DR, Chen Y, McEwen DP, O'Malley HA, Bharucha V, Meadows LS, Knudsen GA, Vilaythong A, Noebels JL, Saunders TL, Scheuer T, Shrager P, Catterall WA, Isom LL. Mice lacking sodium channel β1 subunits display defects in neuronal excitability, sodium channel expression, and nodal architecture. J Neurosci. 2004;24:4030–4042. - PMC - PubMed

Publication types