. 2010 Jun 23;30(25):8502-11.
doi: 10.1523/JNEUROSCI.1497-10.2010.

Neural correlates of active avoidance behavior in superior colliculus

Affiliations

Neural correlates of active avoidance behavior in superior colliculus

Jeremy D Cohen et al. J Neurosci. .

Abstract

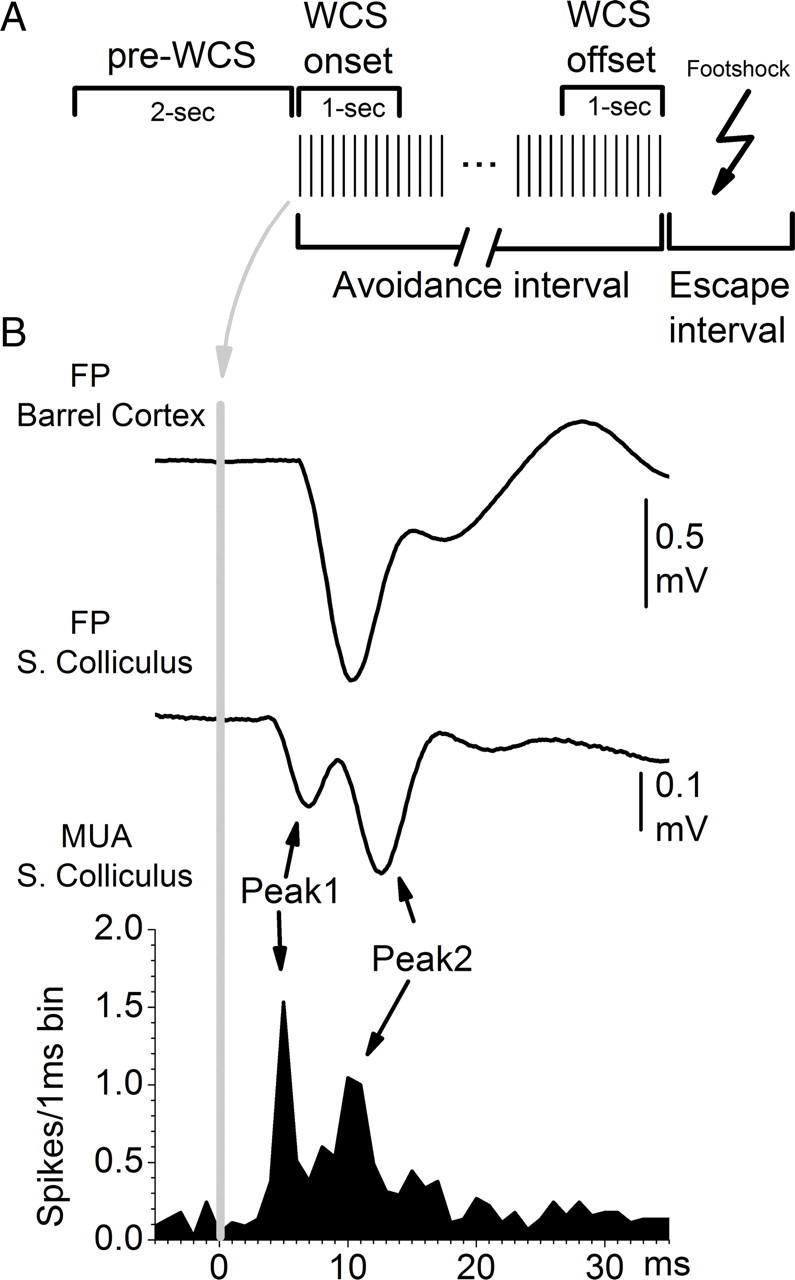
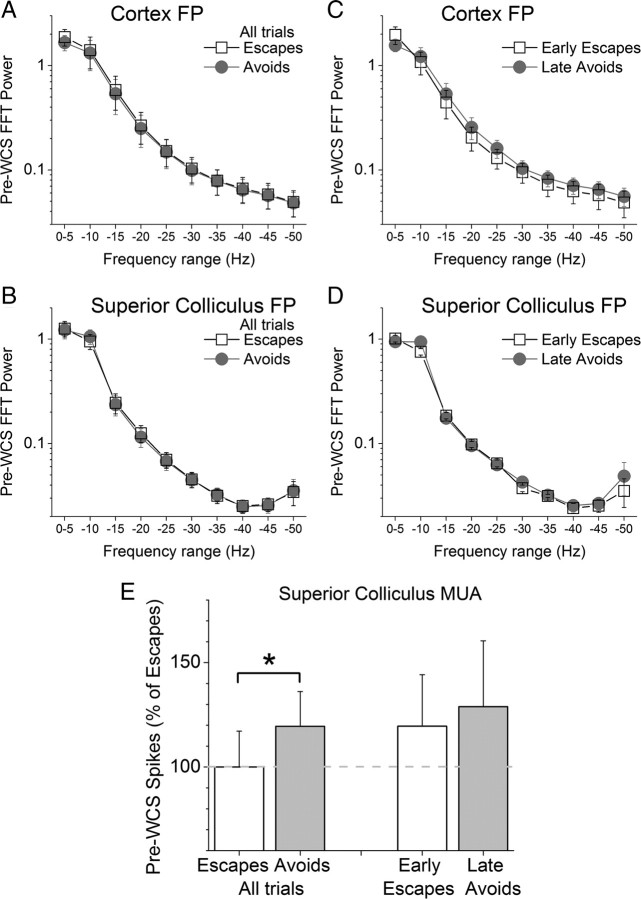
Active avoidance of harmful situations seems highly adaptive, but the underlying neural mechanisms are unknown. Rats can effectively use the superior colliculus during active avoidance to detect a salient whisker conditioned stimulus (WCS) that signals an aversive event. Here, we recorded unit and field potential activity in the intermediate layers of the superior colliculus of rats during active avoidance behavior. During the period preceding the onset of the WCS, avoids are associated with a higher firing rate than escapes (unsuccessful avoids), indicating that a prepared superior colliculus is more likely to detect the WCS and lead to an avoid. Moreover, during the WCS, a robust ramping up of the overall firing rate is observed for trials leading to avoids. The firing rate ramping is not caused by shuttling and may serve to drive downstream circuits to avoid. Therefore, a robust neural correlate of active avoidance behavior is found in the superior colliculus, emphasizing its role in the detection of salient sensory signals that require immediate action.


Figures

Figure 1.
Figure 1.
Schematic representation of pre-WCS and WCS periods measured during each trial and typical FP and MUA responses. A, Two seconds of pre-WCS activity was measured to determine the state of barrel cortex and superior colliculus before each trial. During the avoidance interval, the WCS consisted of a 10 Hz train delivered to the whisker pad. Measurements were done on the 10 first stimuli (WCS onset) and the last 10 stimuli (WCS offset) during the avoidance interval. B, Typical FP (barrel cortex and superior colliculus) and MUA [superior colliculus (S. Colliculus)] responses evoked by each stimulus in the WCS train. Peak1 and Peak2 FP and MUA responses in superior colliculus are pointed by arrows. Each response shown is the average of 30 trials and corresponds to the first stimulus in the WCS train.
Figure 2.
Figure 2.
Pre-WCS neural activity and active avoidance. A, B, Fast Fourier transform power spectrum of pre-WCS barrel cortex FP activity taken from the period of 2 s before each WCS trial during trials that lead to escapes and those that lead to avoids for all trials (A) and during early-session escapes and late-session avoids trials (B). C, D, Fast Fourier transform power spectrum of pre-WCS superior colliculus FP activity taken from the period of 2 s before each WCS trial during trials that lead to escapes and those that lead to avoids for all trials (C) and during early-session escapes and late-session avoids trials (D). E, Spontaneous pre-WCS MUA in superior colliculus for the period of 2 s before each WCS trial during trials that lead to escapes and those that lead to avoids for all trials and during early-session escapes and late-session avoids trials. MUA for each group is plotted as a percentage of escapes (All trials). For all trials, MUA preceding the onset of each trial is significantly larger when the trial leads to an avoid than when it leads to an escape. *p < 0.01. FFT, Fast Fourier transform. Error bars are ± SEM.
Figure 3.
Figure 3.
FP activity in barrel cortex and superior colliculus evoked by the WCS during performance in the active avoidance task. Barrel cortex FP peak amplitude responses (A) and superior colliculus (SC) FP peak1 (B) and FP peak2 (C) responses evoked by the WCS (10 Hz) that lead to either avoids or escapes in the task are shown. The responses are plotted from WCS onset, which includes the first 10 stimuli in the WCS, and from WCS offset, which includes the last 10 stimuli in the WCS, before avoids or before the onset of the escape interval for escapes. Statistically significant differences (p < 0.05) between avoids and escapes are marked with brackets on the right. If present, the red bracket and asterisk indicate a significant difference between avoids and escapes from WCS onset, and the blue bracket and asterisk indicate a significant difference between avoids and escapes from WCS offset. ns, Not significant. p > 0.05. Error bars are ± SEM.
Figure 4.
Figure 4.
FP activity in barrel cortex and superior colliculus evoked by the WCS during performance in the active avoidance task comparing early-session escapes and late-session avoids. Barrel cortex FP peak amplitude responses (A) and superior colliculus FP peak1 (B) and FP peak2 (C) responses evoked by the WCS (10 Hz) for early-session escapes and late-session avoids are shown. The responses are plotted from WCS onset, which includes the first 10 stimuli in the WCS, and from WCS offset, which includes the last 10 stimuli in the WCS, before late-session avoids or before the onset of the escape interval for early-session escapes. Statistically significant differences (p < 0.05) between late-session avoids and early-session escapes are marked with vertical brackets on the right. If present, the red bracket and asterisk indicate a significant difference between late-session avoids and early-session escapes from WCS onset, and the blue bracket and asterisk indicate a significant difference between late-session avoids and early-session escapes from WCS offset. ns, Not significant. p > 0.05. Error bars are ± SEM.
Figure 5.
Figure 5.
MUA in superior colliculus evoked by the WCS during performance in the active avoidance task. Superior colliculus MUA peak1 (A), peak2 (B), peak3 (C), and peak1–3 (D) responses evoked by the WCS (10 Hz) that lead to either avoids or escapes in the task are shown. The responses are plotted from WCS onset, which includes the first 10 stimuli in the WCS, and from WCS offset, which includes the last 10 stimuli in the WCS, before avoids or before the onset of the escape interval for escapes. Statistically significant differences (p < 0.05) between avoids and escapes are marked with vertical brackets on the right. If present, the red bracket and asterisk indicate a significant difference between avoids and escapes from WCS onset, and the blue bracket and asterisk indicate a significant difference between avoids and escapes from WCS offset. ns, Not significant. p > 0.05. Error bars are ± SEM.
Figure 6.
Figure 6.
MUA in superior colliculus evoked by the WCS during performance in the active avoidance task comparing early-session escapes and late-session avoids. Superior colliculus MUA peak1 (A), peak2 (B), and peak3 (C) responses evoked by the WCS (10 Hz) that lead to either late-session avoids or early-session escapes in the task are shown. The responses are plotted from WCS onset, which includes the first 10 stimuli in the WCS, and from WCS offset, which includes the last 10 stimuli in the WCS, before late-session avoids or before the onset of the escape interval for early-session escapes. Statistically significant differences (p < 0.05) between late-session avoids and early-session escapes are marked with vertical brackets on the right. If present, the red bracket and asterisk indicate a significant difference between late-session avoids and early-session escapes from WCS onset, and the blue bracket and asterisk indicate a significant difference between late-session avoids and early-session escapes from WCS offset. ns, Not significant. p > 0.05. Error bars are ± SEM.
Figure 7.
Figure 7.
Enhanced MUA in superior colliculus during avoids is not caused by shuttling. Superior colliculus peak1–3 (3–90 ms) MUA evoked by the WCS (10 Hz) from WCS offset comparing trials that lead to avoids or escapes in the task with the same measurements taken from intertrial crossings (ITCs), when the animal spontaneously shuttles in the cage without a WCS, is shown. The responses are plotted from WCS offset, which includes the last 10 stimuli in the WCS for avoids, escapes, and ITCs. Statistically significant differences (p < 0.05) are marked with vertical brackets on the right. The blue bracket and asterisk indicate a significant difference between avoids and ITCs. ns, Not significant. p > 0.05. Error bars are ± SEM.

Similar articles

Cited by

References

    1. Ahissar E. Temporal-code to rate-code conversion by neuronal phase-locked loops [letter] Neural Comput. 1998;10:597–650. - PubMed
    1. Bandler R, Depaulis A, Vergnes M. Identification of midbrain neurones mediating defensive behaviour in the rat by microinjections of excitatory amino acids. Behav Brain Res. 1985;15:107–119. - PubMed
    1. Boatman JA, Kim JJ. A thalamo-cortico-amygdala pathway mediates auditory fear conditioning in the intact brain. Eur J Neurosci. 2006;24:894–900. - PubMed
    1. Bouton ME. Learning and behavior. Sunderland: Sinauer; 2007.
    1. Brandao ML, Cardoso SH, Melo LL, Motta V, Coimbra NC. Neural substrate of defensive behavior in the midbrain tectum. Neurosci Biobehav Rev. 1994;18:339–346. - PubMed

Publication types

LinkOut - more resources