. 2010 Jun 23;30(25):8581-90.
doi: 10.1523/JNEUROSCI.5486-09.2010.

Kisspeptin signaling is required for peripheral but not central stimulation of gonadotropin-releasing hormone neurons by NMDA

Affiliations

Kisspeptin signaling is required for peripheral but not central stimulation of gonadotropin-releasing hormone neurons by NMDA

Xavier d'Anglemont de Tassigny et al. J Neurosci. .

Abstract

NMDA and kisspeptins can stimulate gonadotropin-releasing hormone (GnRH) release after peripheral or central administration in mice. To determine whether these agonists act independently or through a common pathway, we have examined their ability to stimulate GnRH/luteinizing hormone (LH) release after peripheral or central administration in Kiss1- or Gpr54 (Kiss1r)-null mutant mice. Peripheral injection of NMDA failed to stimulate GnRH/LH release in prepubertal or gonadally intact mutant male mice. Dual-labeling experiments indicated a direct activation of Kiss1-expressing neurons in the arcuate nucleus. In contrast, central injection of NMDA into the lateral ventricle increased plasma LH levels in both Kiss1 and Gpr54 mutant male mice similar to the responses in wild-type mice. Central injection of NMDA stimulated c-Fos expression throughout the hypothalamus but not in GnRH neurons, suggesting an action at the nerve terminals only. In contrast, kisspeptin-10 stimulated LH release after both central and peripheral injection but induced c-Fos expression in GnRH neurons only after central administration. Finally, central injection of NMDA induces c-Fos expression in catecholamine- and nitric oxide-producing neurons in the hypothalamus of mutant mice, indicating a possible kisspeptin-independent GnRH/LH release by NMDA through activation of these neurons. Thus, NMDA may act at both GnRH cell bodies (kisspeptin-independent) and nerve terminals (kisspeptin-dependent) in a dual way to participate in the GnRH/LH secretion in the male mouse.


Figures

Figure 1.
Figure 1.
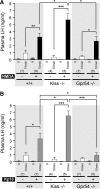
Absence of LH release after peripheral NMDA injection in Kiss1- and Gpr54-null mice. A, Bar graph showing the mean ± SEM of LH levels in wild-type (+/+), Kiss1-null (Kiss−/−), and Gpr54-null (Gpr54−/−) adult male mice 10 min after PBS, NMDA, or Kp10 intraperitoneal injection. B, Bar graph showing the mean ± SEM of plasma LH levels in prepubertal mice of each genotype 10 min after PBS, NMDA, or Kp10 intraperitoneal injection. **p < 0.01 (one-way ANOVA, followed by Student–Newman–Keuls test). Numbers in brackets indicate animal number used in each treatment group. C, Representative coronal sections of dual-labeled immunocytochemistry showing the absence of c-Fos staining (black nuclei) in GnRH neurons (brown) in hypothalamus from wild-type or Kiss1-null mice that showed high plasma LH after peripheral stimulation with NMDA (left) or Kp10 (middle and right). Scale bar, 100 μm. All photographs are the same scale. Inset box is 4× magnification. 3V, Third ventricle.
Figure 2.
Figure 2.
Activation of kisspeptin neurons in the Arc after NMDA intraperitoneal injection in Kiss1-null mice. Kisspeptin neurons were identified by LacZ expression revealed by X-gal staining. A, Representative coronal section showing X-gal-positive cells (blue dots) and c-Fos-immunopositive nuclei (brown staining) in the Arc. NMDA intraperitoneal injection induced intense c-Fos staining (right) compared with PBS (left). Inset boxes are magnified views, and arrows indicate X-gal cells with c-Fos staining. Scale bars: 50 μm for low magnification; 10 μm for high magnification. 3V, Third ventricle. B, Bar graph showing the mean ± SEM number of X-gal-positive cells per section after PBS (−) or NMDA (+) intraperitoneal injection. Numbers in brackets indicate animal number used in each treatment group. C, Bar graph showing the mean ± SEM percentage of X-gal-positive cells with c-Fos per section after PBS (−) or NMDA (+) intraperitoneal injection. **p = 0.0025 (unpaired t test).
Figure 3.
Figure 3.
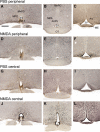
Induction of c-Fos after peripheral or central injection of NMDA in wild-type mice. Representative low-magnification photomicrographs showing immunocytochemical c-Fos staining (black nuclei) in three different coronal sections. A–C, c-Fos staining 2 h after PBS intraperitoneal injection. D–F, c-Fos staining 2 h after NMDA intraperitoneal injection. Note the intense labeling in Arc and moderate labeling in OVLT. G–I, c-Fos staining 2 h after PBS intracerebroventricular injection. Staining is very similar to intraperitoneal PBS. J–L, c-Fos staining 2 h after NMDA intracerebroventricular injection. Note that c-Fos labeling is intense in every periventricular hypothalamic region. Regions containing GnRH cell bodies, such as MnPO, MPO, and MPA (in light brown in A, D, G, J), show high concentration of black nuclei, indicating activated cells, only after intracerebroventricular NMDA (J). Regions known to regulate GnRH neuron activity have high c-Fos staining after intracerebroventricular NMDA only (J, K). Regions known to contain Kp neurons, such as the Arc, show high c-Fos staining after intraperitoneal and intracerebroventricular NMDA (F, L). The sexually dimorphic AVPV containing a Kp neuron population has high c-Fos staining after intracerebroventricular NMDA exclusively (K). 3V, Third ventricle; OT, optic tract. Scale bar, 600 μm. All photographs are the same scale.
Figure 4.
Figure 4.
Effect of central NMDA or Kp10 injection on LH release in Kiss1- and Gpr54-null mice. A, Bar graph showing the mean ± SEM of LH levels in wild-type (+/+), Kiss1-null (Kiss−/−), and Gpr54-null (Gpr54−/−) mice before (0) and 10 min after PBS (−) or NMDA (+) intracerebroventricular injection. B, Bar graph showing the mean ± SEM of LH levels in mice of each genotype, before (0) and 10 min after PBS (−) or Kp10 (+) intracerebroventricular injection. *p < 0.05, **p < 0.01, ***p < 0.001, 10 min after PBS vs 10 min after NMDA or Kp10 in same genotype (unpaired t test), or 10 min after either NMDA or Kp10 between the three genotypes (one-way ANOVA, followed with Student–Newman–Keuls test). Numbers in brackets indicate animal number used in each condition.
Figure 5.
Figure 5.
Absence of c-Fos induction in GnRH neurons after central injection of NMDA. Representative photomicrographs of dual-labeled immunocytochemistry coronal sections showing GnRH neurons (brown) and c-Fos staining (black nuclei) in the MS/DBB region. A, Absence of c-Fos staining in GnRH neurons of PBS-treated wild-type mice. B, High c-Fos staining density but absence of c-Fos expression in GnRH neurons of NMDA-treated wild-type mice. C, GnRH neurons expressing c-Fos (arrows) in Kp10-treated wild-type mice. D, Absence of c-Fos staining in GnRH neurons of PBS-treated Kiss1-null mice. E, High c-Fos staining density but absence of c-Fos expression in GnRH neurons of NMDA-treated Kiss1-null mice. F, GnRH neurons expressing c-Fos (arrows) in Kp10-treated Kiss1-null mice. G, Absence of c-Fos staining in GnRH neurons of PBS-treated Gpr54-null mice. H, High c-Fos staining density but absence of c-Fos expression in GnRH neurons of NMDA-treated Gpr54-null mice. I, Absence of c-Fos staining in GnRH neurons of Kp10-treated Gpr54-null mice. 3V, Third ventricle. Scale bar, 100 μm. All photographs are the same scale.
Figure 6.
Figure 6.
Quantification of GnRH neurons with c-Fos expression after central injections. Bar graphs represent the percentage of GnRH neurons expressing c-Fos (mean ± SEM) in the MS/DBB (left) or in the OVLT/POA (right) regions. Arrows indicate gray regions on the brain map. In each region, bar graphs show percentage of GnRH neurons (mean ± SEM) with c-Fos in wild-type (+/+), Kiss1-null (Kiss−/−), and Gpr54-null (Gpr54−/−) mice before (0) and 10 min after PBS (white bars), NMDA (black bars), or Kp10 (gray bars) intracerebroventricular injection. *p < 0.05, **p < 0.01, ***p < 0.001 when different treatments on same genotype were compared. a vs c, p < 0.001; b vs c, p < 0.01; a vs b, not significant when different genotypes were compared with the same treatment in the same subpopulation (one-way ANOVA, followed with Student–Newman–Keuls test in both comparison tests). Numbers in brackets indicate animal number used in each condition.
Figure 7.
Figure 7.
Catecholamine- and nitric oxide-producing neurons are responsive to NMDA in Kiss1 and Gpr54 mutant mice. Catecholamine- and nitric oxide-producing neurons were immunostained for TH and nNOS, respectively. A, Bar graph showing the mean ± SEM percentage of TH neurons counted per section with c-Fos in the AVPV and PeN of wild-type (+/+), Kiss1-null (Kiss−/−), and Gpr54-null (Gpr54−/−) mice after PBS (−) or NMDA (+) intracerebroventricular injection. B, Representative dual-labeled immunocytochemistry showing TH (brown cytoplasmic staining) and c-Fos (dark blue nucleic staining) in the AVPV after PBS or NMDA. Arrows indicate TH neurons with c-Fos. C, Bar graph showing the mean ± SEM percentage of nNOS neurons counted per section with c-Fos in the AVPV, MnPO, MPO, MS, and OVLT of +/+, Kiss−/−, and Gpr54−/− mice after PBS (−) or NMDA (+) intracerebroventricular injection. D, Representative dual-labeled immunocytochemistry showing nNOS (brown cytoplasmic staining) and c-Fos (dark blue nucleic staining) in the MPO after PBS or NMDA. Arrows indicate nNOS neurons with c-Fos. Boxes indicate magnified views of photos on the right. 3V, Third ventricle. Scale bars: B, 125 μm at low magnification and 15 μm at high magnification; D, 150 μm at low magnification and 20 μm at high magnification. ***p < 0.001 versus PBS in same genotype (unpaired t test).
Figure 8.
Figure 8.
A schematic representation of the possible effect of peripheral versus central injection of NMDA on the GnRH neuronal network. A, Peripherally injected NMDA does not reach the POA in which the GnRH neuron cell bodies are located. NMDA can penetrate into the Arc through the fenestrated capillaries of the ME. NMDA requires Kp neuron activation, revealed by c-Fos expression, in the Arc, and Kp release then activates GnRH release from the nerve terminals. B, Central injection of NMDA activates nNOS- and TH-containing neurons in the POA, revealed by c-Fos expression. This may result in production of the diffusible gas NO and the release of catecholamines (CAT), which might stimulate GnRH release. Question mark denotes an undetermined mechanism. NMDAR, NMDA receptor.

Similar articles

Cited by

References

    1. Beauvillain JC, Tramu G. Immunocytochemical demonstration of LH-RH, somatostatin, and ACTH-like peptide in osmium-postfixed, resin-embedded median eminence. J Histochem Cytochem. 1980;28:1014–1017. - PubMed
    1. Bhat GK, Mahesh VB, Lamar CA, Ping L, Aguan K, Brann DW. Histochemical localization of nitric oxide neurons in the hypothalamus: association with gonadotropin-releasing hormone neurons and co-localization with N-methyl-d-aspartate receptors. Neuroendocrinology. 1995;62:187–197. - PubMed
    1. Bourguignon JP, Gerard A, Mathieu J, Simons J, Franchimont P. Pulsatile release of gonadotropin-releasing hormone from hypothalamic explants is restrained by blockade of N-methyl-d,l-aspartate receptors. Endocrinology. 1989;125:1090–1096. - PubMed
    1. Bourguignon JP, Gérard A, Purnelle G, Czajkowski V, Yamanaka C, Lemaître M, Rigo JM, Moonen G, Franchimont P. Duality of glutamatergic and GABAergic control of pulsatile GnRH secretion by rat hypothalamic explants. I. Effects of antisense oligodeoxynucleotides using explants including or excluding the preoptic area. J Neuroendocrinol. 1997;9:183–191. - PubMed
    1. Brace H, Latimer M, Winn P. Neurotoxicity, blood-brain barrier breakdown, demyelination and remyelination associated with NMDA-induced lesions of the rat lateral hypothalamus. Brain Res Bull. 1997;43:447–455. - PubMed

MeSH terms

LinkOut - more resources