. 2010 Jun 23;30(25):8591-601.
doi: 10.1523/JNEUROSCI.0049-10.2010.

Ventromedial and orbital prefrontal neurons differentially encode internally and externally driven motivational values in monkeys

Affiliations

Ventromedial and orbital prefrontal neurons differentially encode internally and externally driven motivational values in monkeys

Sebastien Bouret et al. J Neurosci. .

Abstract

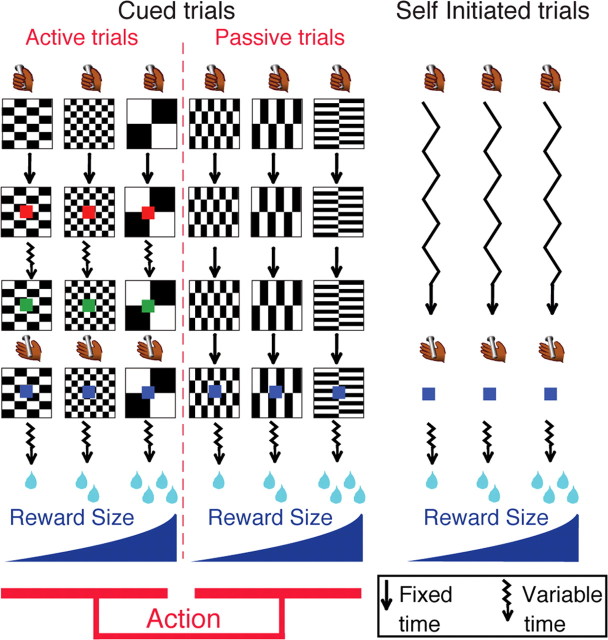
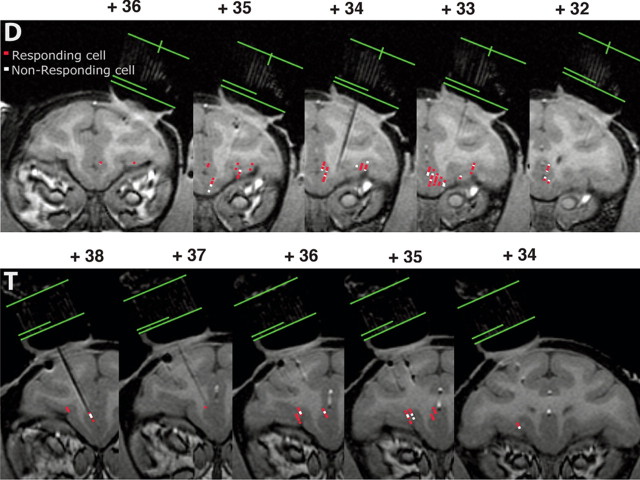
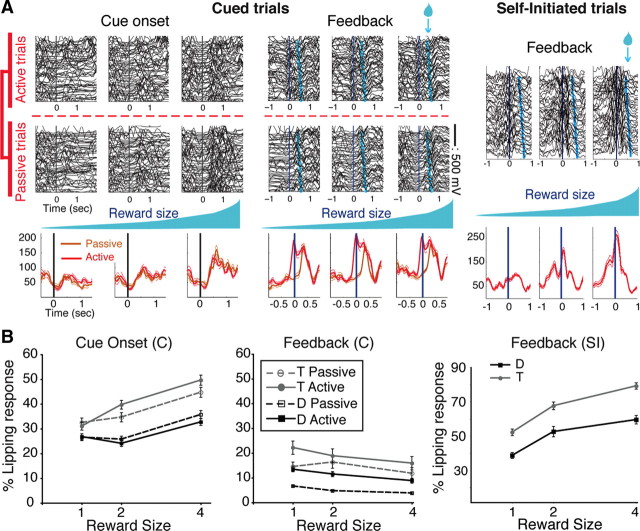
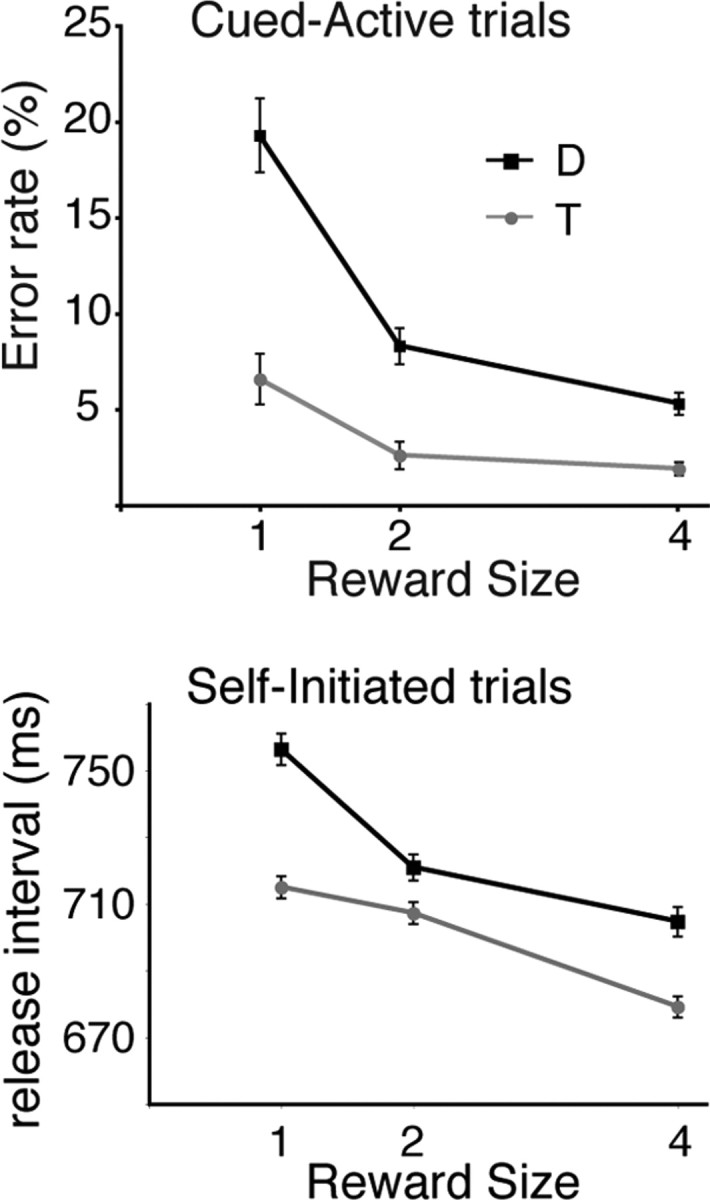
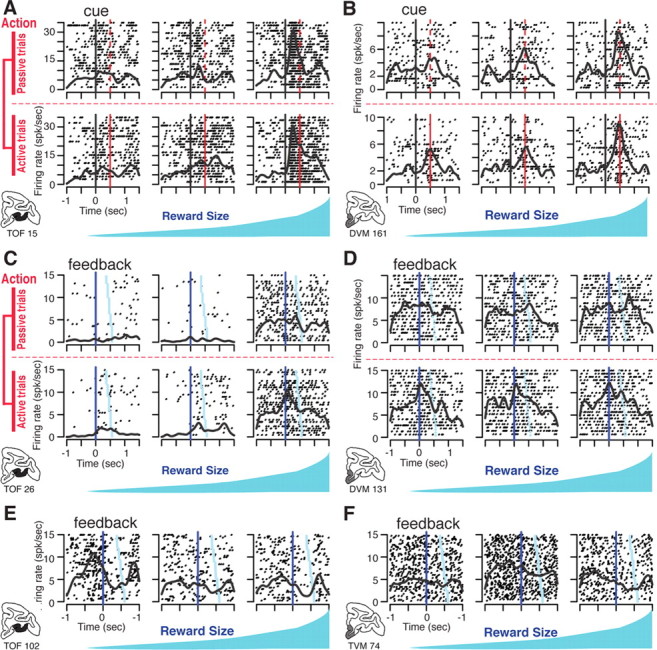
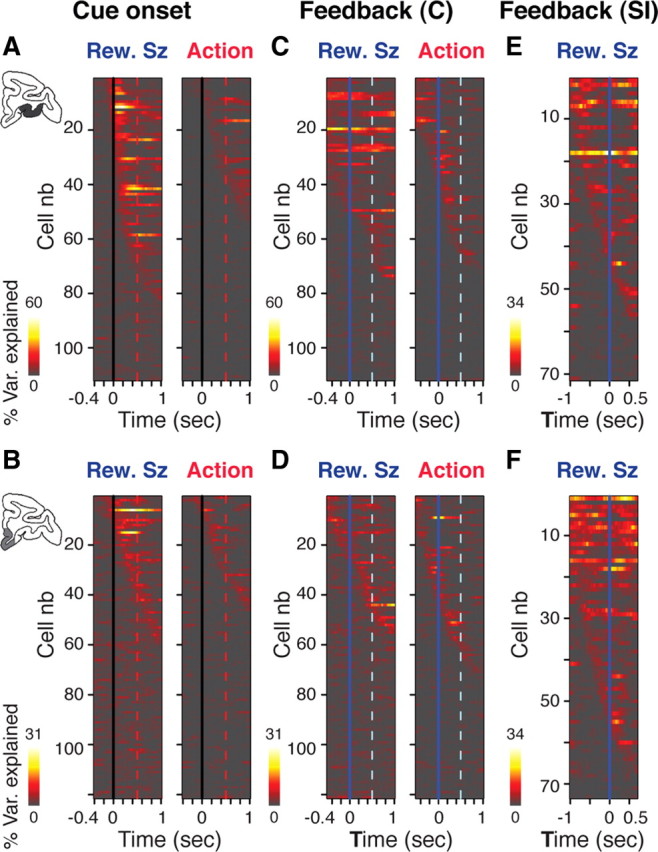
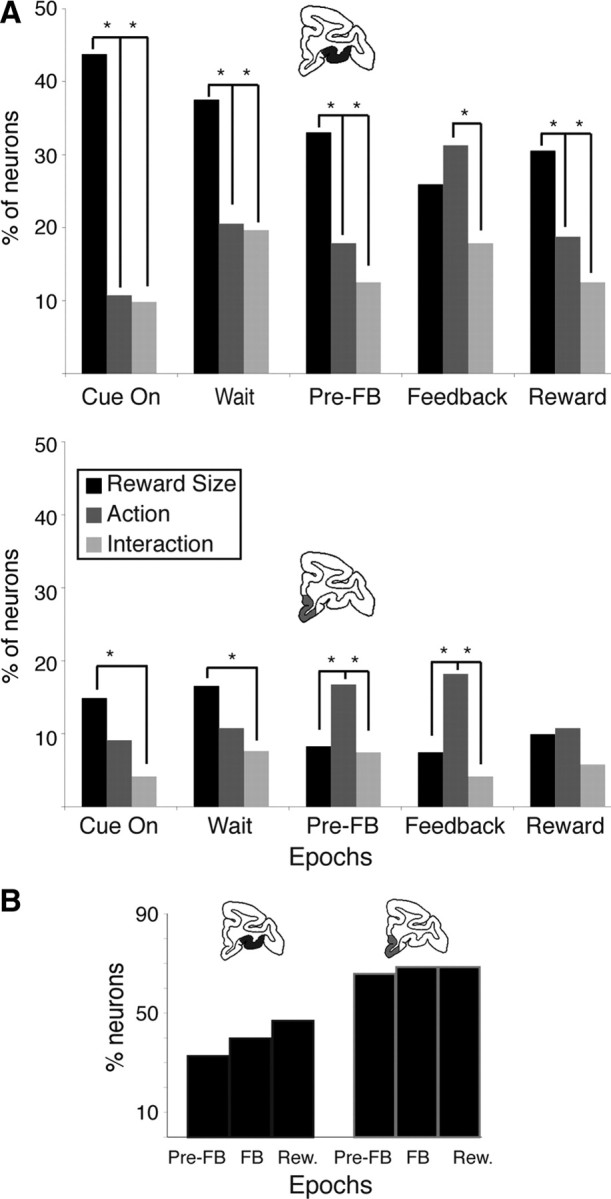
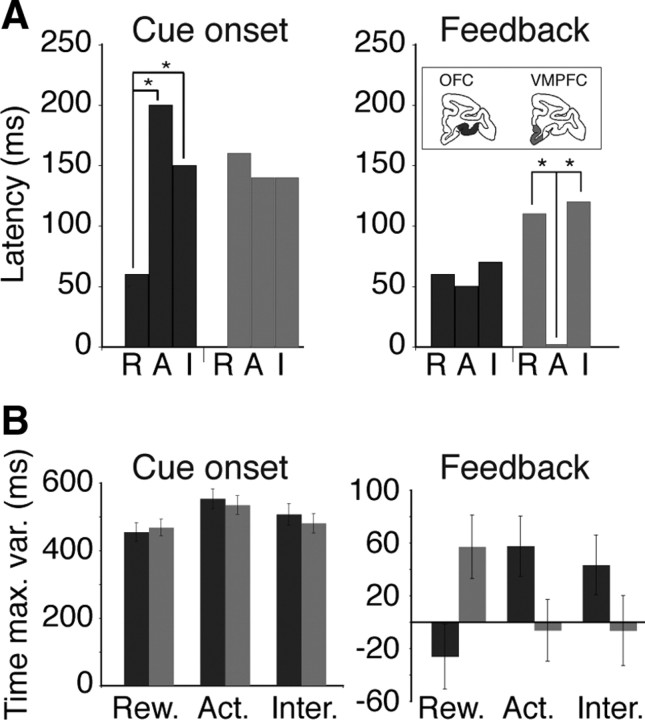
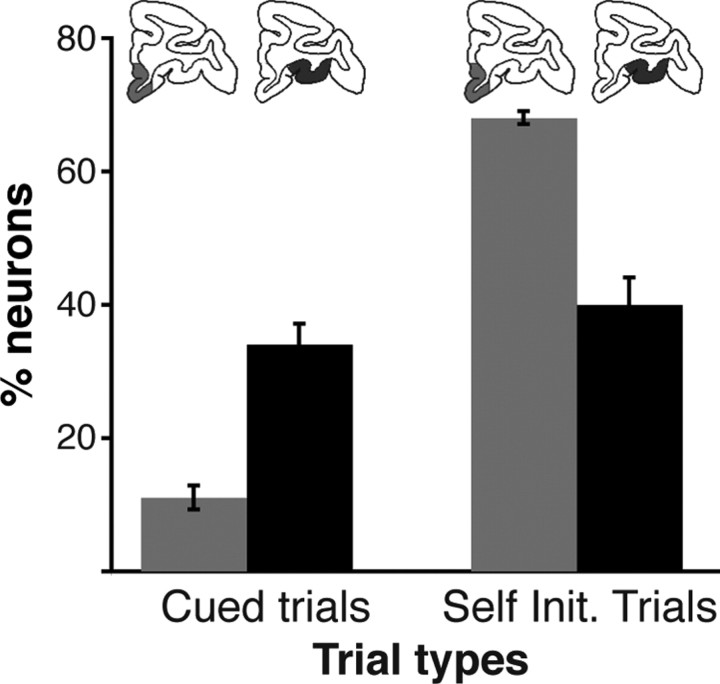
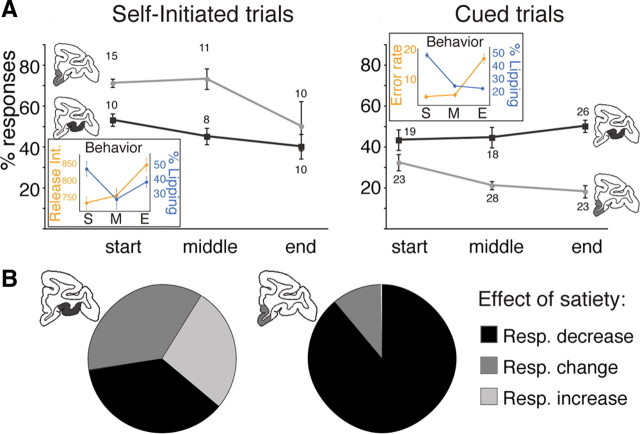
The value of events that predict future rewards, thereby driving behavior, is sensitive to information arising from external (environmental) and internal factors. The ventral prefrontal cortex, an anatomically heterogeneous area, has information related to this value. We designed experiments to compare the contribution of two distinct subregions, orbital and ventromedial, of the ventral prefrontal cortex to the encoding of internal and external factors controlling the perceived motivational value. We recorded the activity of single neurons in both regions in monkeys while manipulating internal and external factors that should affect the perceived value of task events. Neurons in both regions encoded the value of task events, with orbitofrontal neurons being more sensitive to external factors such as visual cues and ventromedial neurons being more sensitive to internal factors such as satiety. Thus, the orbitofrontal cortex emphasizes signals for evaluating environment-centered, externally driven motivational processes, whereas ventromedial prefrontal cortex emphasizes signals more suited for subject-centered, internally driven motivational processes.


Figures

Figure 1.
Figure 1.
Experimental design. Monkeys perform three types of trials: cued active (left), cued passive (middle), and self-initiated (right). Every trial starts when the monkey touches a bar. In cued trials, a visual cue (black and white pattern) indicates a combination of two factors: reward size (one, two, or four drops of fluid) and action (active or passive trial). Left, In the cued active trials, monkeys must release the bar when a red spot (wait signal) after a variable time (jagged arrows) turns green (go signal), in which case a feedback (blue spot) appears, followed by the reward. Middle, In cued passive trials, the feedback appears 2 s after cue onset independently of the monkey's behavior. Right, Self-initiated trials simply required touching and releasing a bar; no cue was present. Self-initiated trials were run in randomly alternating blocks of approximately 60 trials with constant reward size (one, two, or four drops).
Figure 2.
Figure 2.
Localization of recording sites using MRI. Monkeys were scanned with an electrode in place in the grid, and recording sites were identified based on surface position (using the grid), depth measurements, and locations of the electrode on the MR images. Green lines indicate the top, bottom, and center of the grid. Numbers indicate the distance from the interaural line in the rostrocaudal axis. Top, Monkey D; bottom, monkey T; red points, responding neurons; white points, nonresponding neurons. In cases where responding and nonresponding neurons overlap, only nonresponding neurons appear. The distribution of responding and nonresponding neurons in the ventral prefrontal cortex appears homogenous.
Figure 3.
Figure 3.
Lipping behavior. A, Representative examples of lipping behavior. In cued trials, lipping in the six conditions (three reward sizes × active vs Passive) is plotted around cue onset (left) and feedback (middle). Right, Lipping around the feedback in the three conditions (three reward sizes) of the self-initiated trials. Data from cued and self-initiated trials were collected separately. Each line is the signal from one trial. For lipping at the cue, passive trials are sorted by time (first at the top), and active trials are sorted by increasing trial duration. For lipping at the feedback, trials are sorted by increasing time between the feedback (t = 0, vertical line) and reward delivery (light blue symbols). For each reward size condition, average signals for all trials (±SEM) are shown below raw traces. In cued trials, average traces for active (red) and passive (orange) trials are plotted separately. The lipping at the cue increases with reward size, with virtually no difference between active and passive trials. At the feedback, lipping is stronger and begins earlier in cued active than in cued passive trials, with little effect of reward size. In self-initiated trials, lipping around the feedback increases with reward size. B, Percentage of lipping responses across conditions for each monkey (mean ± SEM). Left, In cued trials, the proportion of lipping responses to cues increased with reward size, with no difference between active and passive trials. Middle, At the feedback in cued trials, lipping responses were significantly more frequent in active than in passive trials, with little effect of reward size. Right, In self-initiated trials, the percentage of lipping responses increased for larger rewards.
Figure 4.
Figure 4.
Bar release behavior. Top, In cued trials, error rates were inversely related to reward size. Bottom, In self-initiated trials, the latency to release the bar from the end of the preceding trial (release interval) decreased for larger rewards.
Figure 5.
Figure 5.
Examples of single unit activity. Each panel (A–F) shows the activity of a different single neuron displayed as rasters (each row of dots shows spike times in one trial) and spike density (continuous black line showing the average firing rate). A, OFC neuron with firing aligned to the time of cue onset (t = 0, black vertical line). The red line indicates the onset of the wait signal in cued active trials (top) and the corresponding time in cued passive trials (bottom). Activity increases with expected reward size. There is no effect of action (no difference between active and passive trials). B, Activity of a VMPFC neuron encoding reward size, but not action. The latency to the response is longer than in the OFC neuron in A. C, OFC neuron with firing aligned on feedback (t = 0) in cued trials. Trials are sorted from top to bottom by increasing interval between feedback and reward delivery (light blue symbols). There is sustained firing in high-reward trials (right), and a transient activation after the feedback in active trials (upper row). D, VMPFC neuron activated at the feedback in cued active trials only. E, OFC neuron activated just before feedback in self-initiated trials with the smallest reward (left). F, VMPFC neuron with a high sustained firing rate during the blocks with intermediate reward in self-initiated trials (center). spk/sec, Spikes per second.
Figure 6.
Figure 6.
Dynamic encoding of action and reward size in OFC and VMPFC. Sliding window ANOVA analysis for all the neurons in OFC (A, C, E) and VMPFC (B, D, F). In each line the color shows the percentage of variance (% Var.) explained by reward size (Rew.Sz; three levels) or action (two levels) for a single neuron in successive 300 ms windows moved in 20 ms steps. Neurons are sorted from top to bottom according to time of maximum variance. A, B, Activity around cue onset (vertical lines) in OFC (A) and VMPFC (B). Encoding of reward size engages more neurons and is generally earlier than that of action, especially in A (OFC). C, D, Activity around the feedback in cued trials (C) in OFC (C) and VMPFC (D ). Encoding of reward size is stronger that of action in OFC, especially before the feedback. In VMPFC, the encoding of reward size is not as prominent as in OFC. Before the feedback, the encoding of action engages more neurons than that of reward size. E, F, Activity around the feedback in self-initiated trials (SI). The encoding of reward size occurs in both regions. It is stronger in F (VMPFC) than in E (OFC).
Figure 7.
Figure 7.
Percentage of responses and mean variance at cue onset and feedback in OFC and VMPFC. Proportion of neurons with a significant response (top) and percentage of variance explained by these significant responses (mean ± SEM, bottom) in sliding window ANOVA. The red vertical dotted line indicates the beginning of the wait period (A, B), and the vertical light blue dotted line indicates the average time of reward delivery (C–F). A, B, Cue onset. A, In OFC, the percentage of neurons encoding reward size (dark blue) increases rapidly. The proportion of neurons encoding action (red) increases through the wait period. More VMPFC neurons are sensitive to reward size (light blue) than to action (orange), but the timing of these two factors is about the same. C, D, Feedback in cued trials. C, In OFC, the proportion of neurons encoding reward size (dark blue line) is stable whereas that of neurons encoding action increases (red line), with the biggest change occurring after feedback. In VMPFC, few neurons encode reward size (light blue). The proportion of neurons encoding action (orange) increases around the time of the feedback. D, The percentage of variance explained by reward size remains higher than that of action in OFC, but not in VMPFC. E, F, Feedback in self-initiated trials. E, A larger proportion of neurons encode reward size in VMPFC (light blue) compared with OFC (dark blue). F, The percentage of variance explained by responding neurons was constant over time and indistinguishable between the two brain areas.
Figure 8.
Figure 8.
Proportion of responding neurons across epochs of a trial. A, Cued trials. Proportion of neurons responding to reward size (black), action (passive vs active; dark gray), and their interaction (light gray) in each of the five epochs in OFC (top) and VMPFC (bottom); *p < 0.05, significant difference in proportion (χ2). More OFC (top) than VMPFC (bottom) neurons respond overall. In OFC (top), neurons predominantly encode reward size except between the feedback (FB) and reward (Rew.) delivery, where the encoding of action peaked. Indeed, the proportion of neurons encoding action after the feedback was greater than in all the other epochs (χ2, p < 0.05). In VMPFC more neurons encode action than reward size both before and after the feedback. B, Self-initiated trials. Percentage of neurons encoding reward size in each of the three epochs in VMPFC (left) and OFC (right). Conventions are as in A. In this case, the percentage of responsive neurons was larger in VMPFC. The proportions of responding neurons were indistinguishable across the three epochs in both OFC and VMPFC.
Figure 9.
Figure 9.
Latencies of responses to action, reward size, and their interaction. A, Median latency of responses to the factors reward size (R), action (A), and their interaction (I) in OFC (black) and VMPFC (gray). At cue onset, OFC neurons started to encode reward size significantly earlier than action and interaction (Wilcoxon test: p < 0.05). In VMPFC, latencies of the three effects were indistinguishable. At the feedback signal, VMPFC neurons started to encode action significantly earlier than reward size and interaction (Wilcoxon test: p < 0.05). In OFC, latencies of the three effects were indistinguishable. B, Time of maximum variance explained after cue onset (left) or around the feedback (right). The time of maximum variance explained of all neurons was analyzed using a two-way ANOVA with “type of effect” (three levels) and region (two levels) as factors. At cue onset, there was a significant effect of type of effect (F (2) = 4.3, p = 0.01) but no effect of region and no interaction (F < 0.5, p > 0.5). Neurons showed a maximum sensitivity to reward (Rew.) size before the effect of the action (Act.) factor peaked (Tukey test, p = 0.01). Around the feedback, there was no effect of type of effect or region factors (F < 0.5, p > 0.5), but their interaction (Inter.) was significant (F (2,690) = 6.5, p = 0.001). In VMPFC, the encoding of action peaked earlier than the encoding of reward size, whereas in OFC the encoding of reward size peaked before that of action.
Figure 10.
Figure 10.
Encoding of reward size across trial types and brain regions. Percentage of neurons encoding reward size in cued trials (means and SEM across five epochs) and self-initiated trials (means and SEM across three epochs). There was a significant effect of region (two-way ANOVA, F (1) = 116, p = 1.6 × 10⁻⁷), no effect of trial type (F (1) = 2, p = 0.2), and a significant interaction (F (1,12) = 77, p = 1.5 × 10⁻⁶). The proportion of neurons encoding reward size was higher in OFC than in VMPFC in cued trials, and the proportion of neurons encoding reward size in OFC was indistinguishable between the two trial types. In the self-initiated (Self Init.) trials, the proportion of neurons encoding reward size in VMPFC was higher than that in OFC or VMPFC in the cued trials.
Figure 11.
Figure 11.
Response modulation with progression in a session and satiety. A, Mean percentages (±SEM) of responses for neurons recorded at the very beginning (start), halfway through (middle), and at the end (end) of a recording session. Numbers indicate number of neurons at each point. Insets, Corresponding behavioral performances (mean and SEM). Monkeys showed a decrease in lipping (blue) and bar release responses (orange) as they progressed through a session (ANOVA, p < 0.05). In self-initiated trials, the proportion of selective neurons decreased in both areas. In cued trials, there was a significant decrease in the proportion of selective neurons in VMPFC, but not in OFC. S, Start; M, middle; E, end. B, Effect of satiety on neuronal responses (Resp.). Neurons in VMPFC (n = 14) and OFC (n = 12) were recorded while monkeys performed the cued trials before and after receiving a large bolus of water early in the session. In VMPFC, eight of nine selective neurons showed a decrease in response. For seven of these, the response disappeared completely. In OFC, an equivalent number of selective neurons (n = 11) showed a decrease, an increase, or a change in response pattern (n = 4, 3, and 4, respectively). The response disappeared for three of four neurons showing a decrease.

References

    1. Amiez C, Joseph JP, Procyk E. Reward encoding in the monkey anterior cingulate cortex. Cereb Cortex. 2006;16:1040–1055. - PMC - PubMed
    1. Balleine BW, Dickinson A. Goal-directed instrumental action: contingency and incentive learning and their cortical substrates. Neuropharmacology. 1998;37:407–419. - PubMed
    1. Behrens TE, Hunt LT, Woolrich MW, Rushworth MF. Associative learning of social value. Nature. 2008;456:245–249. - PMC - PubMed
    1. Berridge KC. Motivation concepts in behavioral neuroscience. Physiol Behav. 2004;81:179–209. - PubMed
    1. Berridge KC, Kringelbach ML. Affective neuroscience of pleasure: reward in humans and animals. Psychopharmacology (Berl) 2008;199:457–480. - PMC - PubMed

Publication types

LinkOut - more resources