

doi: 10.1523/JNEUROSCI.1409-10.2010.
Direct evidence for wake-related increases and sleep-related decreases in synaptic strength in rodent cortex
Affiliations
- PMID: 20573912
- PMCID: PMC2903226
- DOI: 10.1523/JNEUROSCI.1409-10.2010
Item in Clipboard
Direct evidence for wake-related increases and sleep-related decreases in synaptic strength in rodent cortex
J Neurosci.
.
Abstract
Despite evidence that waking is associated with net synaptic potentiation and sleep with depression, direct proof for changes in synaptic currents is lacking in large brain areas such as the cerebral cortex. By recording miniature EPSCs (mEPSCs) from frontal cortex slices of mice and rats that had been awake or asleep, we found that the frequency and amplitude of mEPSCs increased after waking and decreased after sleep, independent of time of day. Recovery sleep after deprivation also decreased mEPSCs, suggesting that sleep favors synaptic homeostasis. Since stronger synapses require more energy, space, and supplies, a generalized renormalization of synapses may be an important function of sleep.
Figures
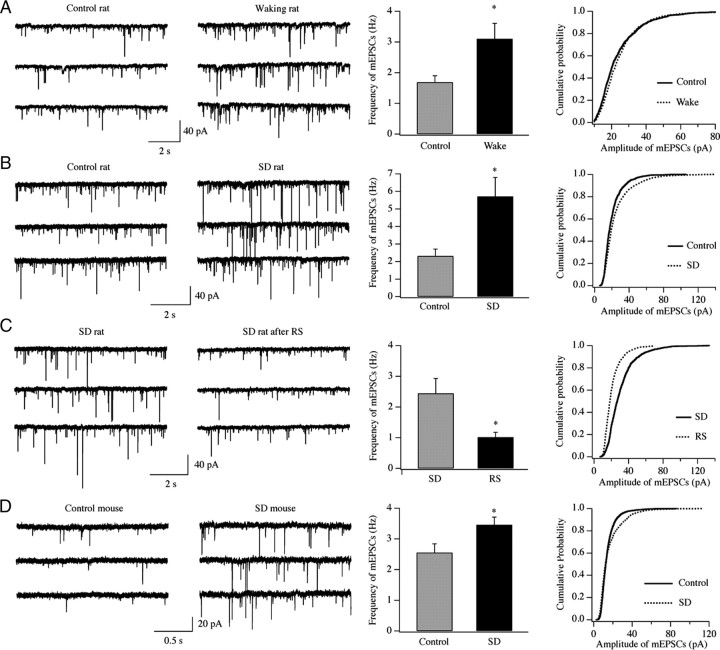
A–D, Synaptic efficacy of glutamatergic synapses on layer II/III pyramidal neurons is enhanced during spontaneous and forced wakefulness in the frontal cortex of rats (A–C) and mice (D). Left, Representative traces of mEPSCs. Middle, Changes in the frequency of mEPSCs (*p < 0.05, t test). Right, cumulative probability of mEPSC amplitude (p < 0.01, Kolmogorov–Smirnov test). The number of animals is as follows: A, n = 4 rats/group (controls, 24 cells; wake, 25 cells); B, n = 7 rats/group (controls, 32 cells; SD rats, 29 cells); C, n = 4 rats/group (SD rats, 10 cells; RS rats, 9 cells); D, n = 4 mice/group (controls, 24 cells; SD rats, 19 cells). To generate cumulative probability curve, 1000 to 2000 events from all recorded neurons in each group were used (A: controls, 1200 events; wake, 1250 events; B: controls, 1576 events, SD rats, 1441 events; C: SD rats, 997 events; RS rats, 900 events; D: controls, 3729 events; SD rats, 3856 events). Note that rats in B have a higher frequency of mEPSCs relative to those in A and C, most likely due to slight changes in the experimental conditions used to prepare the slices.
References
-
- Attwell D, Laughlin SB. An energy budget for signaling in the grey matter of the brain. J Cereb Blood Flow Metab. 2001;21:1133–1145. - PubMed
-
- Bellina V, Huber R, Rosanova M, Mariotti M, Tononi G, Massimini M. Cortical excitability and sleep homeostasis in humans: a TMS/hd-EEG study. J Sleep Res. 2008;17(Suppl 1)
-
- Carskadon MA, Acebo C, Jenni OG. Regulation of adolescent sleep: implications for behavior. Ann N Y Acad Sci. 2004;1021:276–291. - PubMed
Publication types
MeSH terms
Grants and funding
LinkOut - more resources
Full Text Sources
Other Literature Sources