

Validation of cross-sectional time series and multivariate adaptive regression splines models for the prediction of energy expenditure in children and adolescents using doubly labeled water
- PMID: 20573939
- PMCID: PMC2903304
- DOI: 10.3945/jn.109.120162
Validation of cross-sectional time series and multivariate adaptive regression splines models for the prediction of energy expenditure in children and adolescents using doubly labeled water
Abstract
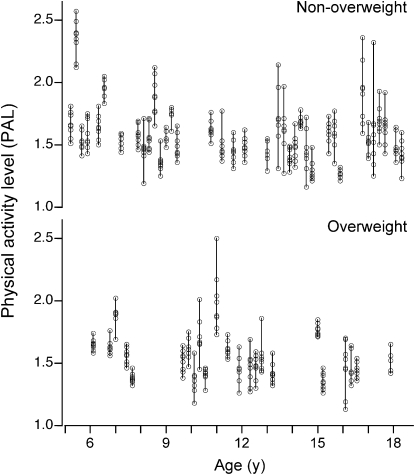
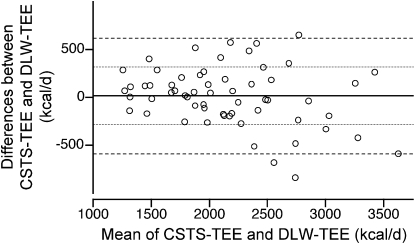
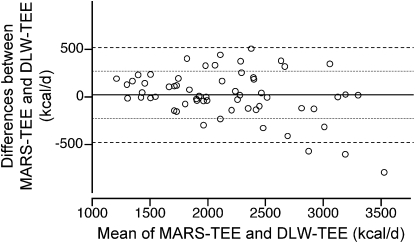
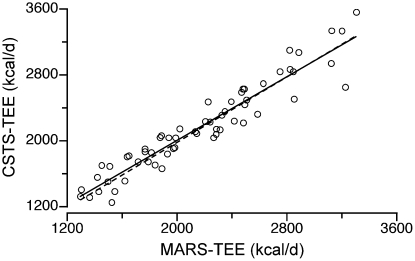
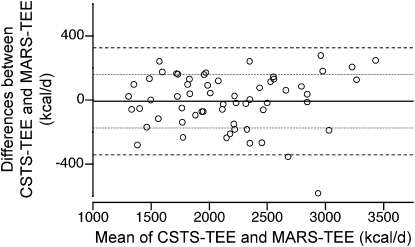
Accurate, nonintrusive, and inexpensive techniques are needed to measure energy expenditure (EE) in free-living populations. Our primary aim in this study was to validate cross-sectional time series (CSTS) and multivariate adaptive regression splines (MARS) models based on observable participant characteristics, heart rate (HR), and accelerometer counts (AC) for prediction of minute-by-minute EE, and hence 24-h total EE (TEE), against a 7-d doubly labeled water (DLW) method in children and adolescents. Our secondary aim was to demonstrate the utility of CSTS and MARS to predict awake EE, sleep EE, and activity EE (AEE) from 7-d HR and AC records, because these shorter periods are not verifiable by DLW, which provides an estimate of the individual's mean TEE over a 7-d interval. CSTS and MARS models were validated in 60 normal-weight and overweight participants (ages 5-18 y). The Actiheart monitor was used to simultaneously measure HR and AC. For prediction of TEE, mean absolute errors were 10.7 +/- 307 kcal/d and 18.7 +/- 252 kcal/d for CSTS and MARS models, respectively, relative to DLW. Corresponding root mean square error values were 305 and 251 kcal/d for CSTS and MARS models, respectively. Bland-Altman plots indicated that the predicted values were in good agreement with the DLW-derived TEE values. Validation of CSTS and MARS models based on participant characteristics, HR monitoring, and accelerometry for the prediction of minute-by-minute EE, and hence 24-h TEE, against the DLW method indicated no systematic bias and acceptable limits of agreement for pediatric groups and individuals under free-living conditions.
Figures
Similar articles
-
Multivariate adaptive regression splines models for the prediction of energy expenditure in children and adolescents.J Appl Physiol (1985). 2010 Jan;108(1):128-36. doi: 10.1152/japplphysiol.00729.2009. Epub 2009 Nov 5. J Appl Physiol (1985). 2010. PMID: 19892930
-
Cross-sectional time series and multivariate adaptive regression splines models using accelerometry and heart rate predict energy expenditure of preschoolers.J Nutr. 2013 Jan;143(1):114-22. doi: 10.3945/jn.112.168542. Epub 2012 Nov 28. J Nutr. 2013. PMID: 23190760 Free PMC article.
-
Prediction of energy expenditure and physical activity in preschoolers.Med Sci Sports Exerc. 2014 Jun;46(6):1216-26. doi: 10.1249/MSS.0000000000000209. Med Sci Sports Exerc. 2014. PMID: 24195866 Free PMC article.
-
Comparison of total and activity energy expenditure estimates from physical activity questionnaires and doubly labelled water: a systematic review and meta-analysis.Br J Nutr. 2021 May 14;125(9):983-997. doi: 10.1017/S0007114520003049. Epub 2020 Jul 28. Br J Nutr. 2021. PMID: 32718378
-
Usefulness of motion sensors to estimate energy expenditure in children and adults: a narrative review of studies using DLW.Eur J Clin Nutr. 2017 Mar;71(3):331-339. doi: 10.1038/ejcn.2017.2. Epub 2017 Feb 1. Eur J Clin Nutr. 2017. PMID: 28145419 Review.
Cited by
-
A Practical and Time-Efficient High-Intensity Interval Training Program Modifies Cardio-Metabolic Risk Factors in Adults with Risk Factors for Type II Diabetes.Front Endocrinol (Lausanne). 2017 Sep 8;8:229. doi: 10.3389/fendo.2017.00229. eCollection 2017. Front Endocrinol (Lausanne). 2017. PMID: 28943861 Free PMC article.
-
Validation of SenseWear Armband and ActiHeart monitors for assessments of daily energy expenditure in free-living women with chronic obstructive pulmonary disease.Physiol Rep. 2013 Nov;1(6):e00150. doi: 10.1002/phy2.150. Epub 2013 Nov 26. Physiol Rep. 2013. PMID: 24400152 Free PMC article.
-
Evaluations of Actiheart, IDEEA® and RT3 monitors for estimating activity energy expenditure in free-living women.J Nutr Sci. 2013 Sep 6;2:e31. doi: 10.1017/jns.2013.18. eCollection 2013. J Nutr Sci. 2013. PMID: 25191581 Free PMC article.
-
A Youth Compendium of Physical Activities: Activity Codes and Metabolic Intensities.Med Sci Sports Exerc. 2018 Feb;50(2):246-256. doi: 10.1249/MSS.0000000000001430. Med Sci Sports Exerc. 2018. PMID: 28938248 Free PMC article.
-
Exploring Metrics to Express Energy Expenditure of Physical Activity in Youth.PLoS One. 2015 Jun 23;10(6):e0130869. doi: 10.1371/journal.pone.0130869. eCollection 2015. PLoS One. 2015. PMID: 26102204 Free PMC article.
References
-
- Abrams SA, Wong WW. Stable isotopes in human nutrition. Laboratory methods and research applications. London: CABI Publishing; 2003.
-
- Livingstone MBE, Coward WA, Prentice AM, Davies PSW, Strain JJ, McKenna PG, Mahoney CA, White JA, Stewart CM, et al. Daily energy expenditure in free-living children: comparison of heart-rate monitoring with the doubly labeled water (2H2 18O) method. Am J Clin Nutr. 1992;56:343–52. - PubMed
-
- Ekelund U, Yngve A, Westerterp K, Sjostrom M. Energy expenditure assessed by heart rate and doubly labeled water in young athletes. Med Sci Sports Exerc. 2002;34:1360–6. - PubMed
-
- Ekelund U, Yngve A, Westerterp K, Sjostrom M. Physical activity assessed by activity monitor and doubly labeled water in children. Med Sci Sports Exerc. 2001;33:275–81. - PubMed
-
- Hoos MB, Plasqui G, Gerver WJ, Westerterp KR. Physical activity level measured by doubly labeled water and accelerometry in children. Eur J Appl Physiol. 2003;89:624–6. - PubMed
Publication types
MeSH terms
Substances
Grants and funding
LinkOut - more resources
Full Text Sources
Other Literature Sources
Miscellaneous
