

Regulation of exocytosis and fusion pores by synaptotagmin-effector interactions
- PMID: 20573977
- PMCID: PMC2921110
- DOI: 10.1091/mbc.E10-04-0285
Regulation of exocytosis and fusion pores by synaptotagmin-effector interactions
Abstract
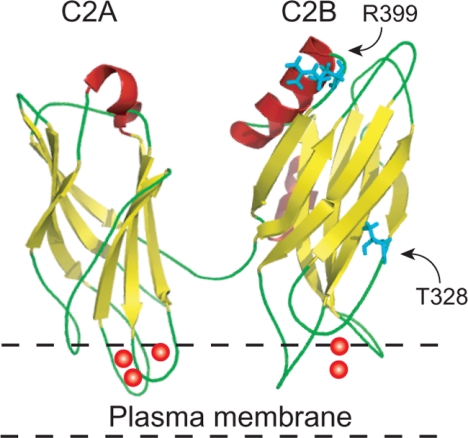
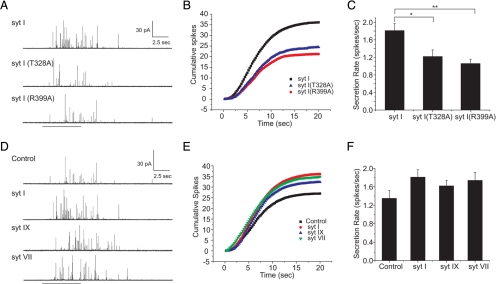
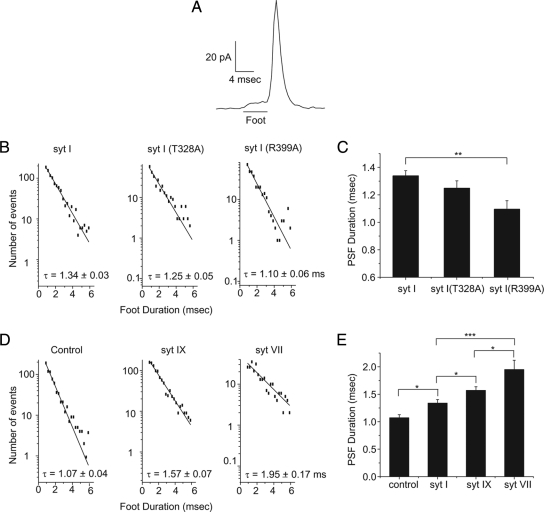
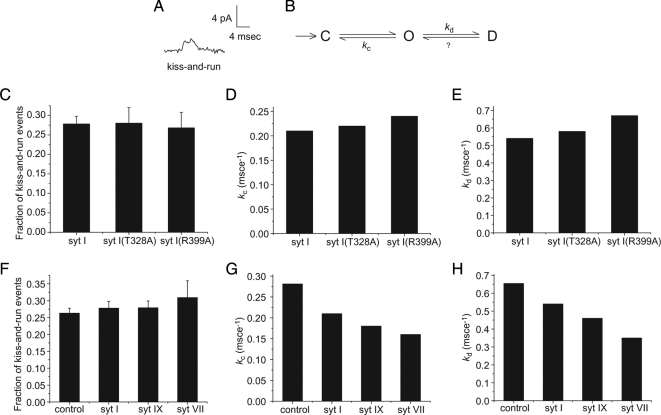
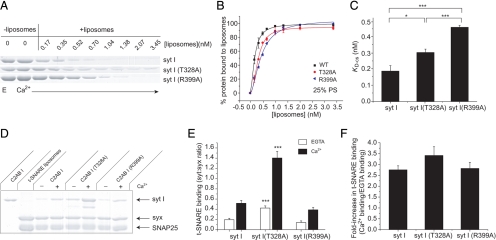
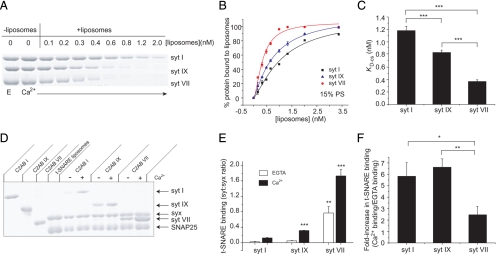
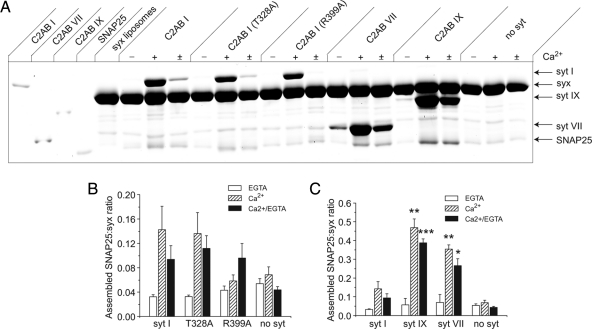
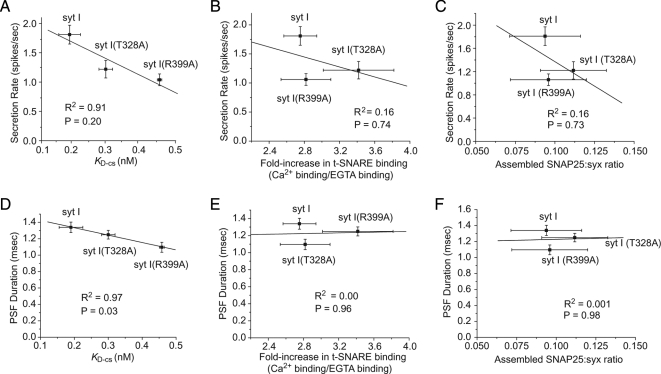
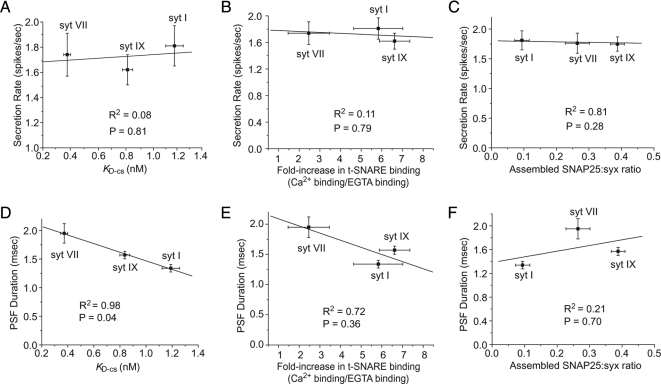
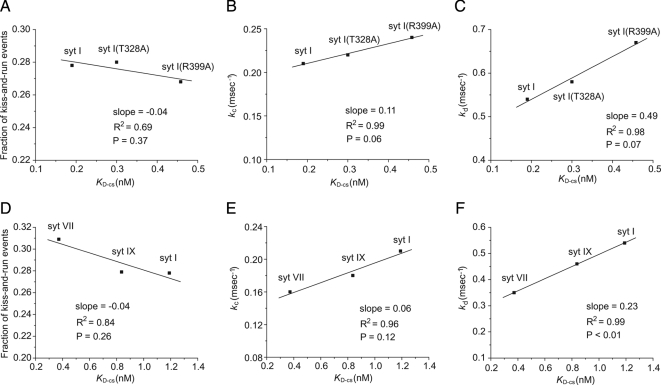
Synaptotagmin (syt) serves as a Ca(2+) sensor in the release of neurotransmitters and hormones. This function depends on the ability of syt to interact with other molecules. Syt binds to phosphatidylserine (PS)-containing lipid bilayers as well as to soluble N-ethylmaleimide sensitive factor receptors (SNAREs) and promotes SNARE assembly. All these interactions are regulated by Ca(2+), but their specific roles in distinct kinetic steps of exocytosis are not well understood. To explore these questions we used amperometry recording from PC12 cells to investigate the kinetics of exocytosis. Syt isoforms and syt I mutants were overexpressed to perturb syt-PS and syt-SNARE interactions to varying degrees and evaluate the effects on fusion event frequency and the rates of fusion pore transitions. Syt I produced more rapid dilation of fusion pores than syt VII or syt IX, consistent with its role in synchronous synaptic release. Stronger syt-PS interactions were accompanied by a higher frequency of fusion events and more stable fusion pores. By contrast, syt-SNARE interactions and syt-induced SNARE assembly were uncorrelated with rates of exocytosis. This associates the syt-PS interaction with two distinct kinetic steps in Ca(2+) triggered exocytosis and supports a role for the syt-PS interaction in stabilizing open fusion pores.
Figures
Similar articles
-
The high-affinity calcium sensor synaptotagmin-7 serves multiple roles in regulated exocytosis.J Gen Physiol. 2018 Jun 4;150(6):783-807. doi: 10.1085/jgp.201711944. Epub 2018 May 24. J Gen Physiol. 2018. PMID: 29794152 Free PMC article. Review.
-
Synaptotagmin-1 utilizes membrane bending and SNARE binding to drive fusion pore expansion.Mol Biol Cell. 2008 Dec;19(12):5093-103. doi: 10.1091/mbc.e08-03-0235. Epub 2008 Sep 17. Mol Biol Cell. 2008. PMID: 18799625 Free PMC article.
-
Synaptotagmin isoforms couple distinct ranges of Ca2+, Ba2+, and Sr2+ concentration to SNARE-mediated membrane fusion.Mol Biol Cell. 2005 Oct;16(10):4755-64. doi: 10.1091/mbc.e05-04-0277. Epub 2005 Aug 10. Mol Biol Cell. 2005. PMID: 16093350 Free PMC article.
-
Phosphatidylserine regulation of Ca2+-triggered exocytosis and fusion pores in PC12 cells.Mol Biol Cell. 2009 Dec;20(24):5086-95. doi: 10.1091/mbc.e09-08-0691. Mol Biol Cell. 2009. PMID: 19828732 Free PMC article.
-
Synaptotagmin IV acts as a multi-functional regulator of Ca2+-dependent exocytosis.Neurochem Res. 2011 Jul;36(7):1222-7. doi: 10.1007/s11064-010-0352-7. Epub 2010 Dec 10. Neurochem Res. 2011. PMID: 21153436 Review.
Cited by
-
Roles for the SNAP25 linker domain in the fusion pore and a dynamic plasma membrane SNARE "acceptor" complex.J Gen Physiol. 2020 Sep 7;152(9):e202012619. doi: 10.1085/jgp.202012619. J Gen Physiol. 2020. PMID: 32722752 Free PMC article.
-
Release mode of large and small dense-core vesicles specified by different synaptotagmin isoforms in PC12 cells.Mol Biol Cell. 2011 Jul 1;22(13):2324-36. doi: 10.1091/mbc.E11-02-0159. Epub 2011 May 5. Mol Biol Cell. 2011. PMID: 21551071 Free PMC article.
-
The high-affinity calcium sensor synaptotagmin-7 serves multiple roles in regulated exocytosis.J Gen Physiol. 2018 Jun 4;150(6):783-807. doi: 10.1085/jgp.201711944. Epub 2018 May 24. J Gen Physiol. 2018. PMID: 29794152 Free PMC article. Review.
-
The role of PS 18:0/18:1 in membrane function.Nat Commun. 2019 Jun 21;10(1):2752. doi: 10.1038/s41467-019-10711-1. Nat Commun. 2019. PMID: 31227693 Free PMC article. Review.
-
Serotonin-secreting enteroendocrine cells respond via diverse mechanisms to acute and chronic changes in glucose availability.Nutr Metab (Lond). 2015 Dec 15;12:55. doi: 10.1186/s12986-015-0051-0. eCollection 2015. Nutr Metab (Lond). 2015. PMID: 26673561 Free PMC article.
References
-
- Augustine G. J. How does calcium trigger neurotransmitter release? Curr. Opin. Neurobiol. 2001;11:320–326. - PubMed
-
- Bai J., Wang C. T., Richards D. A., Jackson M. B., Chapman E. R. Fusion pore dynamics are regulated by synaptotagmin*t-SNARE interactions. Neuron. 2004;41:929–942. - PubMed
-
- Bennett M. K., Calakos N., Scheller R. H. Syntaxin: a synaptic protein implicated in docking of synaptic vesicles at presynaptic active zones. Science. 1992;257:255–259. - PubMed
Publication types
MeSH terms
Substances
Grants and funding
LinkOut - more resources
Full Text Sources
Molecular Biology Databases
Miscellaneous
