. 2010 Aug 15;21(16):2944-52.
doi: 10.1091/mbc.E10-05-0421. Epub 2010 Jun 23.

Phosphatidic acid plays a regulatory role in clathrin-mediated endocytosis

Affiliations

Phosphatidic acid plays a regulatory role in clathrin-mediated endocytosis

Costin N Antonescu et al. Mol Biol Cell. .

Abstract

Clathrin-mediated endocytosis (CME) is the main route of internalization of receptor-ligand complexes. Relatively little is known about the role of specific lipids in CME, in particular that of phosphatidic acid (PA). We examined the effect of altering cellular PA levels on CME by manipulating the activities and/or levels of either phospholipase D (PLD1 and PLD2) or diacylglycerol kinase (DGK), two enzyme classes involved in PA production. DGK inhibition resulted in a dramatic reduction of cellular PA, measured directly using an enzyme-coupled reaction, which resulted in a decreased rate of EGFR internalization measured biochemically. This corresponded to a decreased rate of clathrin-coated pit (CCP) initiation and increased lifetimes of productive CCPs, as determined by quantitative live-cell total internal reflection fluorescence microscopy. Unexpectedly, PLD inhibition caused an increase in cellular PA, suggesting that PLD activity negatively regulates PA synthesis by other more productive pathways. Consistent with opposite effects on cellular PA levels, PLD inhibition had opposite effects on EGFR internalization and CCP dynamics, compared with DGK inhibition. Importantly, the constitutive internalization of transferrin receptors was unaffected by either treatment. These findings demonstrate that PA plays a regulatory rather than obligatory role in CME and differentially regulates ligand-stimulated CME of EGFR.


Figures

Figure 1.
Figure 1.
Primary and secondary alcohols inhibit CME. (A) Tfn internalization was measured in BSC-1 cells treated with either 1- or 2-butanol (1%, vol/vol) for 20 min or left untreated (control), as indicated. Shown are the means ± SE of 3–5 independent experiments. * p < 0.05, relative to corresponding time point of the control condition. (B) PA levels were determined in cells either treated with 1% 1-butanol for 20 min or left untreated (control). Shown are the means ± SE of three independent experiments. (C) BSC-1 cells transfected with GFP-PH WT or PIP2-binding deficient mutant were treated as indicated, rounded-up and imaged as described in Materials and Methods. Shown are fluorescence micrographs representative of at least 2 independent experiments. (D) BSC-1 cells stably expressing σ2-GFP were treated as indicated, fixed and then imaged as described in Materials and Methods. Shown are fluorescence micrographs representative of 3 independent experiments. Scale bars 10 μm.
Figure 2.
Figure 2.
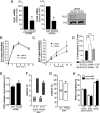
FIPI enhances EGF internalization, PA levels and CCP initiation and turnover. Tfn (A) or EGF (B) internalization was measured in BSC-1 cells treated with 750 nM FIPI or vehicle only (0.1% DMSO, control), as indicated. Shown are the means ± SE of seven independent experiments. (C) The amount of Tfn or EGF internalized was normalized and expressed as a percentage of that seen in corresponding control cells in each experiment. Shown are the means ± SE of seven independent experiments. *p < 0.05. (D) PA levels were determined in cells treated as in A compared with control. Shown are the means ± SE of nine independent experiments. *p <0.05. (E–H) The results of TIR-FM imaging and CCP lifetime decomposition in cells treated or not with 750 nM FIPI are shown. (E) CCP initiation rate, lifetimes of CCP abortive (F) and productive (G) subpopulations and (H) relative contributions of CCP subpopulations. Error bars, cell-to-cell variation; the length of the lifetime bars in F and G denotes the t50-spread of the distribution. The number of CCP trajectories (n) and cells (k) for each condition are control (DMSO): n = 40557, k = 30; and FIPI: n = 31875, k = 30. (E) *p < 0.05, (F–H) *p < 10−8.
Figure 3.
Figure 3.
siRNA silencing of PLD1/2 enhances EGF internalization, PA levels and CCP initiation and turnover. (A) BSC-1 cells transfected with siRNA targeting PLD1 and PLD2 or control siRNA and were subjected to RNA isolation and qRT-PCR detection of PLD1 and PLD2 mRNA content (left panels, means ± SE of 5–6 independent experiments (*p < 0.05) or to immunoblotting with PLD1-specific antibodies (right panel, an immunoblot representative of four independent experiments). Tfn (B) or EGF (C) internalization was measured in BSC-1 cells treated with siRNA targeting PLD1/2 or control siRNA, as indicated. Shown are the means ± SE of 3–5 independent experiments. (D) The amount of Tfn or EGF internalized was normalized and expressed as a percentage of that seen in control cells in each experiment. Shown are the means ± SE of 3–5 independent experiments. *p < 0.05 (E–H) Results of TIR-FM imaging and CCP lifetime decomposition in cells treated with either control or PLD1/2 siRNAs are shown. (E) CCP initiation rate, lifetimes of CCP abortive (F) or productive (G) subpopulations and (H) relative contributions of CCP subpopulations. Error bars, cell-to-cell variation; the length of the lifetime bars in F–G denotes the t50-spread of the distribution. The number of CCP trajectories (n) and cells (k) for each condition are control siRNA: n = 50692, k = 40; and PLD1/2 siRNA: n = 49491, k = 30. (E) *p < 0.05, (F–H) *p < 10−8.
Figure 4.
Figure 4.
Inhibition of DGK reduces cellular PA levels and inhibits EGF but not Tfn internalization. (A) BSC-1 cells were treated with the DGK inhibitor R59949 (30 μM) with or without the PLD inhibitor FIPI (750 nM) or left untreated (0.1% DMSO vehicle, control) for 20 min as indicated before determining the cellular PA content. Shown are the means ± SE of seven independent experiments *p < 0.05. (B) Tfn or (C) EGF internalization or (D) Tfn internalization in the presence of unlabeled 2 ng/ml EGF was measured in BSC-1 cells treated or not with 30 μM R59949 as indicated. Shown are the means ± SE of six independent experiments. *p < 0.05, relative to corresponding time point of the control condition.
Figure 5.
Figure 5.
Inhibition of DGK reduces CCP initiation and turnover of productive CCPs. Results of TIR-FM imaging and CCP lifetime decomposition in cells treated or not with 30 μM R59949 are shown. (A) CCP initiation rate, lifetimes of (B) abortive or (C) productive CCP subpopulations and (D) relative contributions of CCP subpopulations. Error bars, cell-to-cell variation; the length of the lifetime in panels B and C denotes the t50 spread of the distribution. The number of CCP trajectories (n) and cells (k) for each condition are control (DMSO): n = 136847, k = 38; and R59949: n = 117965, k = 41. (A) *p < 0.05 (B–D) *p < 10−8.
Figure 6.
Figure 6.
EGF treatment does not affect the reduction of PA levels due to inhibition of DGK. BSC-1 cells were treated with either (A) the PLD inhibitor FIPI (750 nM) or (B) the DGK inhibitor R59949 (30 μM) or left untreated (0.1% DMSO vehicle, control) for 20 min as indicated and then stimulated or not with EGF, as indicated for 5 min. Cells were then immediately subject to extraction of lipids and determination of cellular PA content. Shown are the means ± SE of six independent experiments. *p < 0.05.
Figure 7.
Figure 7.
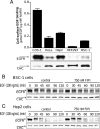
FIPI treatment leads to delay of EGFR degradation. (A) Cell surface EGF binding and EGFR expression levels were determined in COS-1, HeLa, HEK293, Hep2, and BSC-1 cells, as indicated. Shown are the means of at least four independent EGF cell surface–binding experiments, as well as an anti-EGFR immunoblot representative of four independent experiments. Membranes were subsequently probed with anti-CHC antibodies as a loading control. BSC-1 (B) or Hep2 (C) cells were treated with 750 nM FIPI or vehicle control (DMSO) for 20 min and then stimulated or not with 100 ng/ml EGF for the indicated time. Whole cell lysates of each condition were subject to immunoblotting with anti-EGFR antibodies. Membranes were subsequently probed with anti-CHC antibodies as a gel loading control.

References

    1. Bligh E. G., Dyer W. J. A rapid method of total lipid extraction and purification. Can. J. Biochem. Physiol. 1959;37:911–917. - PubMed
    1. Botelho R. J., Teruel M., Dierckman R., Anderson R., Wells A., York J. D., Meyer T., Grinstein S. Localized biphasic changes in phosphatidylinositol-4,5-bisphosphate at sites of phagocytosis. J. Cell Biol. 2000;151:1353–1368. - PMC - PubMed
    1. Boucrot E., Saffarian S., Massol R., Kirchhausen T., Ehrlich M. Role of lipids and actin in the formation of clathrin-coated pits. Exp. Cell Res. 2006;312:4036–4048. - PMC - PubMed
    1. Cai J., Abramovici H., Gee S. H., Topham M. K. Diacylglycerol kinases as sources of phosphatidic acid. Biochim. Biophys. Acta. 2009;1791:942–948. - PMC - PubMed
    1. Chomczynski P., Mackey K. Short technical reports. Modification of the TRI reagent procedure for isolation of RNA from polysaccharide- and proteoglycan-rich sources. Biotechiques. 1995;19:942–945. - PubMed

Publication types

MeSH terms