. 2010 Dec;51(12):6483-95.
doi: 10.1167/iovs.10-5410. Epub 2010 Jun 23.

Intralysosomal iron induces lysosomal membrane permeabilization and cathepsin D-mediated cell death in trabecular meshwork cells exposed to oxidative stress

Affiliations

Intralysosomal iron induces lysosomal membrane permeabilization and cathepsin D-mediated cell death in trabecular meshwork cells exposed to oxidative stress

Yizhi Lin et al. Invest Ophthalmol Vis Sci. 2010 Dec.

Abstract

Purpose: To investigate the role of intralysosomal redox-active iron in oxidative stress-induced damage in trabecular meshwork (TM) cells.

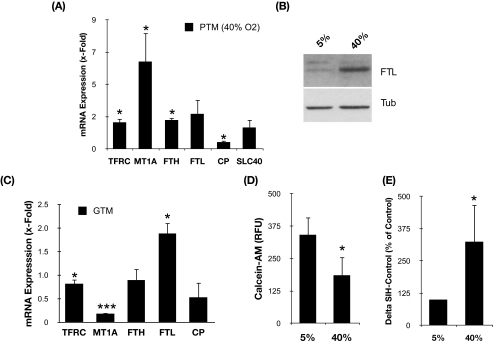
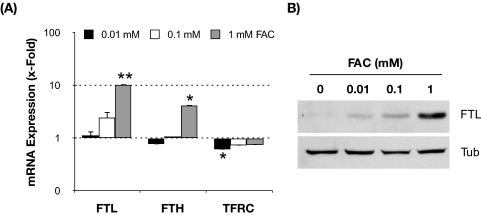
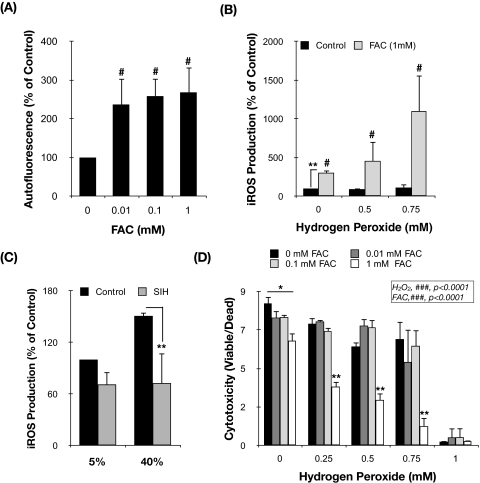
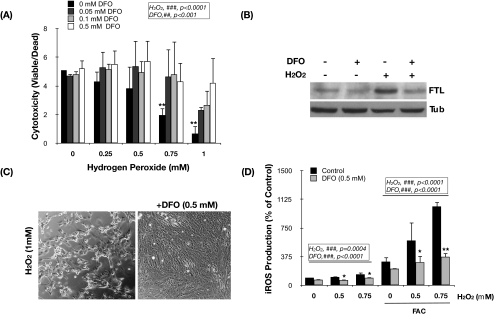
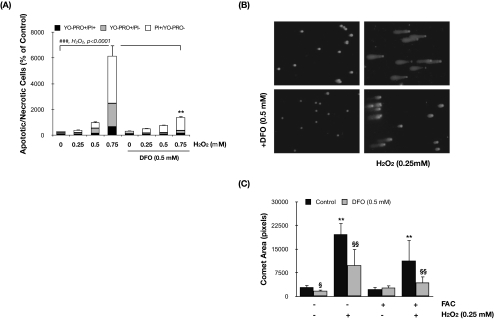
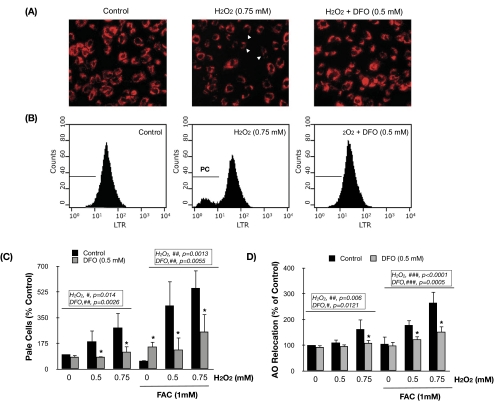
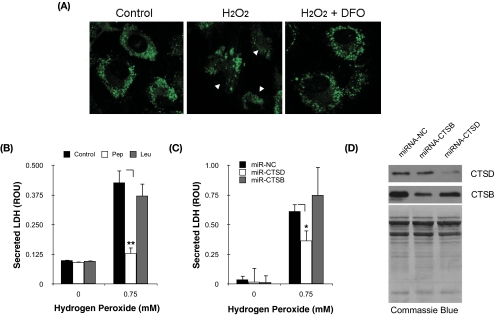
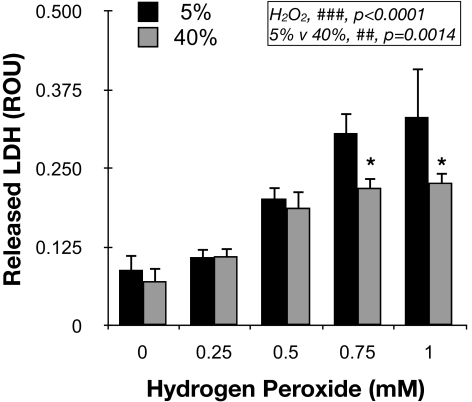
Methods: Chronic oxidative stress was applied using the hyperoxic model; acute oxidative stress was applied with H(2)O(2). Microarray analysis was performed using microarrays. mRNA and protein levels were quantified by real-time PCR and Western blot analysis, respectively. Redox-active iron was monitored using calcein-AM. Apoptosis was quantified using double staining. DNA damage was evaluated by single-cell gel electrophoresis assay. Lysosomal permeabilization was monitored using uptake and acridine orange relocation techniques. Intracellular ROS production was quantified using H(2)DCFDA. Cytosolic translocation of cathepsins was visualized with pepstatin-A-BODIPY-FL. Chemical inhibition of cathepsins was achieved with leupeptin and pepstatin A. Silencing of cathepsin expression was accomplished with miRNA sequences. Lysosomal iron chelation was achieved with desferrioxamine.

Results: Chronically stressed TM cells showed elevated levels of redox-active iron and altered expression of genes involved in intracellular iron homeostasis. Although iron increased ROS production and lipofuscin levels and sensitized TM cells to H(2)O(2), intralysosomal iron chelation completely protected the cells against H(2)O(2)-induced cell death and apoptosis. The protective effect of desferrioxamine was mediated by the prevention of lysosomal ROS generation and the rupture of lysosomal membrane, with the subsequent release of cathepsin D into the cytosol.

Conclusions: These results indicate that the generation of intralysosomal ROS induces lysosomal membrane permeabilization and the release of cathepsin D into the cytosol, leading to TM cell death. Here, the authors propose a mechanism by which oxidative stress might contribute to the decrease in cellularity reported in the TM tissue with both aging and disease.


Figures

Figure 1.
Figure 1.
(A) Relative mRNA expression levels of genes involved in intracellular iron homeostasis in confluent porcine primary cultures grown for 2 weeks at 40% O2 compared with 5% O2 quantified by qPCR. (B) Protein levels of FTL assayed by Western blot analysis. (C) Relative mRNA expression levels of genes involved in intracellular iron homeostasis in GTM-3 compared with NTM-5 quantified by qPCR. (D) Intracellular calcein-induced fluorescence levels in primary cultures of porcine TM cells grown at 5% O2 and 40% O2 atmosphere. (E) Percentage of increase in calcein-induced fluorescence after addition of SIH. Values represent mean ± SD. *P < 0.05; ***P < 0.001.
Figure 2.
Figure 2.
Expression levels of genes involved in intracellular iron homeostasis in TM cells supplemented with increasing concentrations of FAC for 3 days. (A) Relative mRNA expression levels quantified by qPCR compared with nontreated cells. Values represent mean ± SD. *P < 0.05; **P < 0.005; n = 3. (B) Representative Western blot of FTL protein levels with increasing concentrations of FAC.
Figure 3.
Figure 3.
Iron increases ROS production and enhanced sensitivity of TM cells to H2O2. (A) Lipofuscin content in TM cells supplemented for 3 days with increasing concentrations of FAC represented as a percentage of nontreated controls. (B) Percentage of increase in iROS production in TM cells supplemented for 24 hours with increasing concentrations of FAC and challenged for 1 hour to a bolus dose of H2O2 compared with nontreated controls. (C) iROS production in TM cells cultured either at 5% O2 or at 40% O2 environment daily treated with SIH (10 μM). Data are represented as a percentage of 5% nontreated control. (D) Levels of viability in TM cells supplemented for 24 hours with FAC and challenged for 3 hours to H2O2. Data are represented as the ratio between viable and dead cells. Values represent mean ± SD. *P < 0.05; **P < 0.005; n = 3 (t-test). #P < 0.05; ###P < 0.0001 (ANOVA).
Figure 4.
Figure 4.
Intralysosomal iron chelation protects TM cells against H2O2-induced iROS production and cell death. (A) Viability levels of TM cells treated for 2 hours with DFO and challenged for 3 hours to a bolus dosage of H2O2. Data are represented as the ratio between viable and dead cells. *Compares effect of H2O2. #Compares DFO effect. (B) Protein levels of FTL, assayed by Western blot analysis, in TM cells treated with H2O2 (0.75 mM) for 24 hours in the absence or presence of DFO (0.5 mM). (C) Light microscopy of TM cells incubated for 24 hours with H2O2 in the absence (left) or presence (right) of DFO. (D) iROS production in TM cells incubated for 24 hours with FAC (1 mM) and challenged to H2O2 in the absence or presence of DFO. Values represent mean ± SD. *P < 0.05; **P < 0.005; n = 3 (t-test). ###P < 0.0001 (ANOVA).
Figure 5.
Figure 5.
Intralysosomal iron chelation protects TM cells against H2O2-induced apoptosis and DNA fragmentation. (A) Percentage of apoptotic and necrotic cells in TM cells treated for 3 hours with H2O2 in the absence or presence of DFO compared with nontreated control cultures. (B) Representative image of DNA fragmentation analyzed by assay in TM cells preincubated or not preincubated with DFO and treated for 1 hour with H2O2. (C) Assay area was scored. Values represent mean ± SD. §P < 0.05; **,§§P < 0.005. *Compares effect of H2O2. §Compares the effect of DFO; n = 3 (t-test). ###P < 0.0001 (ANOVA).
Figure 6.
Figure 6.
Intralysosomal iron chelation protects TM cells against H2O2-induced LMP. Representative fluorescence microscopy (A) and flow cytometry (B) image of TM cells showing the protection of DFO against LMP, identified as cells with decreased LTR red fluorescence (pale cells) using the LTR uptake technique. (C) Percentage of pale cells quantified by flow cytometry using the LTR uptake technique compared with nontreated control. (D) LMP evaluated by the percentage of increase in mean green fluorescence, quantified by flow cytometry, compared with nontreated control using the AO relocation technique. Values represent mean ± SD. *P < 0.05; n = 3 (t-test). #P < 0.05; ##P < 0.001; ###P < 0.0001 (ANOVA).
Figure 7.
Figure 7.
Cytosolic CTSD mediates H2O2-induced cell death in TM cells. (A) Confocal microscopy image showing the localization of CTSD-BODIPY FL-pepstatin A complexes in H2O2-treated cells in the absence or presence of DFO. Arrowheads: cytosolic localization of complexes. (B) Levels of cytotoxicity, quantified by LDH release, in TM cells challenged to H2O2 in the presence of leupeptin (0.1 mM) or pepstatin A (0.1 mM). (C) Levels of cytotoxicity, quantified by LDH release, in TM cells challenged to H2O2 in the presence of constructs expressing microRNA sequences to silence CTSD or CTSB. (D) Protein levels of CTSD and CTDB in TM cells nucleofected with miRNA-CTSB or miRNA-CTSD. Total protein levels were evaluated by Coomassie Blue staining. Values represent mean ± SD. *P < 0.05; **P < 0.005; n = 3.
Figure 8.
Figure 8.
Resistance of chronically stressed TM cells to acute oxidative challenge. Levels of cytotoxicity, quantified by LDH release, in TM cells grown for 2 weeks at either 5% O2 or 40% O2 challenged for 3 hours to a bolus dosage of H2O2. Values represent mean ± SD. *P < 0.05; n = 3 (t-test). ##P < 0.001, ###P < 0.0001 (ANOVA).

References

    1. Leske MC, Wu S-Y, Hennis A, Honkanen R, Nemesure B, Group BS. Risk factors for incident open-angle glaucoma: the Barbados Eye Studies. Ophthalmology. 2008;115:85–93 - PubMed
    1. Ziangirova GG, Antonova OV. [Lipid peroxidation in the pathogenesis of primary open-angle glaucoma]. Vestn Oftalmol. 2003;119:54–55 - PubMed
    1. Saccà SC, Pascotto A, Camicione P, Capris P, Izzotti A. Oxidative DNA damage in the human trabecular meshwork: clinical correlation in patients with primary open-angle glaucoma. Arch Ophthalmol. 2005;123:458–463 - PubMed
    1. He Y, Leung KW, Zhang Y-H, et al. Mitochondrial complex I defect induces ROS release and degeneration in trabecular meshwork cells of POAG patients: protection by antioxidants. Invest Ophthalmol Vis Sci. 2008;49:1447–1458 - PubMed
    1. Izzotti A, Saccà SC, Cartiglia C, De Flora S. Oxidative deoxyribonucleic acid damage in the eyes of glaucoma patients. Am J Med. 2003;114:638–646 - PubMed

Publication types

MeSH terms