. 2010 Sep 30;116(13):2266-76.
doi: 10.1182/blood-2009-10-250472. Epub 2010 Jun 23.

Crucial roles of B7-H1 and B7-DC expressed on mesenteric lymph node dendritic cells in the generation of antigen-specific CD4+Foxp3+ regulatory T cells in the establishment of oral tolerance

Affiliations

Crucial roles of B7-H1 and B7-DC expressed on mesenteric lymph node dendritic cells in the generation of antigen-specific CD4+Foxp3+ regulatory T cells in the establishment of oral tolerance

Tomohiro Fukaya et al. Blood. .

Abstract

Oral tolerance is a key feature of intestinal immunity, generating systemic tolerance to fed antigens. However, the molecular mechanism mediating oral tolerance remains unclear. In this study, we examined the role of the B7 family members of costimulatory molecules in the establishment of oral tolerance. Deficiencies of B7-H1 and B7-DC abrogated the oral tolerance, accompanied by enhanced antigen-specific CD4(+) T-cell response and IgG(1) production. Mesenteric lymph node (MLN) dendritic cells (DCs) displayed higher levels of B7-H1 and B7-DC than systemic DCs, whereas they showed similar levels of CD80, CD86, and B7-H2. MLN DCs enhanced the antigen-specific generation of CD4(+)Foxp3(+) inducible regulatory T cells (iT(regs)) from CD4(+)Foxp3(-) T cells rather than CD4(+) effector T cells (T(eff)) relative to systemic DCs, owing to the dominant expression of B7-H1 and B7-DC. Furthermore, the antigen-specific conversion of CD4(+)Foxp3(-) T cells into CD4(+)Foxp3(+) iT(regs) occurred in MLNs greater than in peripheral organs during oral tolerance under steady-state conditions, and such conversion required B7-H1 and B7-DC more than other B7 family members, whereas it was severely impaired under inflammatory conditions. In conclusion, our findings suggest that B7-H1 and B7-DC expressed on MLN DCs are essential for establishing oral tolerance through the de novo generation of antigen-specific CD4(+)Foxp3(+) iT(regs).


Figures

Figure 1
Figure 1
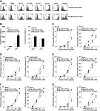
Deficiencies of B7-H1 and B7-DC abrogate oral tolerance. Wild-type (WT) mice (A-B), Cd80/Cd86−/− mice (C-D), B7h1−/− mice (E-F), B7dc−/− mice (G-H), and B7h2−/− mice (I-J; 5 per group) were fed PBS (none) or OVA protein, and then systemically immunized with OVA protein 7 days after the oral priming. Subsequently, serum and Sp CD4+ T cells were collected from each group of mice 14 days after systemic immunization. (A,C,E,G,I) Serum OVA-specific IgG1 production was measured by ELISA. (B,D,F,H,J) Proliferative response of Sp CD4+ T cells to WT Sp CD11c+ DCs in the presence or absence of OVA protein was measured by [3H]thymidine incorporation. *P < .01 compared with nonfed mice. Data are the mean ± SD, and the results are representative of 4 independent experiments.
Figure 2
Figure 2
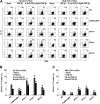
Role of the B7 family in the ability of systemic and MLN CD11c+ DCs to prime antigen-specific naive CD4+Foxp3 T cells. (A) Expression of the indicated molecules on Sp or MLN CD11c+ DCs in WT mice was analyzed by flow cytometry. Data are represented by a histogram, and numbers represent mean fluorescence intensity. Data are representative of 4 independent experiments. (B) Production of IL-6 (left panel) and TGF-β1 (right panel) by Sp or MLN CD11c+ DCs in WT mice stimulated or not stimulated with CpG ODN for 18 hours measured by ELISA. *P < .01 compared with Sp CD11c+ DCs. Data are the mean ± SD, and the results are representative of 4 independent experiments. (C-G) Proliferative response of Sp KJ1-26+ Foxp3EGFP− T cells to Sp or MLN CD11c+ DCs obtained from WT mice (C), Cd80/Cd86−/− mice (D), B7h1−/− mice (E), B7dc−/− mice (F), and B7h2−/− mice (G) in the presence or absence of OVA protein (left panel) or OVAp (right panel) was measured by [3H]thymidine incorporation. *P < .01 compared with Sp CD11c+ DCs. Data are the mean ± SD, and the results are representative of 4 independent experiments.
Figure 3
Figure 3
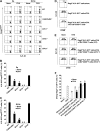
Role of B7 family members in the ability of systemic and MLN CD11c+ DCs to generate antigen-specific CD4+Foxp3+ iTregs from CD4+Foxp3 T cells. Generation of KJ1-26+Foxp3EGFP+ T cells from Sp KJ1-26+Foxp3EGFP− T cells by Sp or MLN CD11c+ DCs obtained from WT mice and the B7−/− mice in neutral conditions in the presence or absence of TGF-β1 (A-B) or TGF-β1 plus RA (C-D) was analyzed by flow cytometry. Data are represented by a dot plot, and numbers represent the proportion of Foxp3EGFP+ cells among gated CD4+ T cells in each quadrant (A,C) and are the percentage of positive cells (B,D). *P < .01 compared with WT mice. Data are the mean ± SD, and the results are representative of 4 independent experiments.
Figure 4
Figure 4
Role of B7 family members in the ability of systemic and MLN CD11c+ DCs to generate antigen-specific TH17 cells from CD4+Foxp3 T cells. Generation of KJ1-26+IL-17+ T cells from Sp KJ1-26+Foxp3EGFP− T cells by Sp (A-B) or MLN (A,C) CD11c+ DCs obtained from WT mice and the B7−/− mice in neutral conditions in the presence or absence of TGF-β1, IL-6 plus TGF-β1, or CpG ODN plus TGF-β1 was analyzed by flow cytometry. Data are represented by a dot plot, and numbers represent the proportion of IL-17+ cells among gated CD4+ T cells in each quadrant (A) and are the percentage of positive cells (B-C). *P < .01 compared with WT mice. Data are the mean ± SD, and the results are representative of 4 independent experiments.
Figure 5
Figure 5
Antigen-specific de novo generation of CD4+Foxp3+ iTregs from CD4+Foxp3 T cells in Sp and MLNs during the induction of oral tolerance. (A-D) Sp KJ1-26+Foxp3EGFP− T cells were transferred into WT mice (5 per group) that had been treated with CpG ODN (B-D), and the animals were subsequently fed PBS (none) or OVA protein the day after the adoptive transfer. (A) Immunofluorescent microscopic analysis of horizontal sections, stained as indicated, from Sp or MLNs on day 11 after the adoptive transfer. Image acquisition information: BIOREVO BZ-9000 fluorescence microscope (KEYENCE); immunofluorescence, 10×, 10×/0.25 objective lenses; room temperature; no imaging medium; Alexa Fluor 488, R-phycoerythrin, Alexa Fluor 647, DAPI fluorochromes; BZ-II Analyzer acquisition software (KEYENCE); JPEG, Preview 3.0.9 (Apple Inc). (B-D) Expression of Foxp3EGFP among gated KJ1-26+ T cells in Sp (B-C) and MLNs (B,D) on day 11 after the adoptive transfer was analyzed by flow cytometry. Data are represented by a dot plot, and numbers represent the proportion of Foxp3EGFP+ cells among gated KJ1-26+ T cells in each quadrant (B) and are the percentage of positive cells (C-D). *P < .01 compared with untreated mice. Data are the mean ± SD, and the results are representative of 4 independent experiments.
Figure 6
Figure 6
Role of the B7 family in antigen-specific de novo generation of CD4+Foxp3+ iTregs from CD4+Foxp3 T cells in Sp and MLNs. (A-C) Sp KJ1-26+Foxp3EGFP− T cells were transferred into WT mice and B7−/− mice (5 per group), and the animals were subsequently fed PBS (none) or OVA protein the day after the adoptive transfer. Expression of Foxp3EGFP among gated KJ1-26+ T cells in Sp (A-B) and MLNs (A,C) on day 11 after the adoptive transfer was analyzed by flow cytometry. Data are represented by a dot plot, and numbers represent the proportion of Foxp3EGFP+ cells among gated KJ1-26+ T cells in each quadrant (A) and are the percentage of positive cells (B-C). *P < .01 compared with WT mice. Data are the mean ± SD, and the results are representative of 4 independent experiments. (D-F) CFSE-labeled Sp Rag2−/−KJ1-26+ T cells (3 × 10⁶/mouse) were transferred into WT mice (5 per group) with or without Sp CD4+CD25+ T cells (106/mouse) obtained from Foxp3EGFPDO11.10 mice (D,F), WT mice (E,F), and B7−/− mice (E-F) that had been fed PBS (none) or OVA protein, and the animals were subsequently injected with OVA protein the day after the adoptive transfer. CFSE dilution among gated KJ1-26+ T cells on day 3 after the injection with OVA protein was analyzed by flow cytometry. Data are represented by a dot plot, and numbers represent the proportion of CFSE dilution among gated KJ1-26+ T cells in each quadrant (D-E) and are the percentage of dividing cells (F). *P < .01 compared with Rag2−/−KJ1-26+ T cells plus OVA. Data are the mean ± SD, and the results are representative of 4 independent experiments.

Similar articles

Cited by

References

    1. Tsuji NM, Kosaka A. Oral tolerance: intestinal homeostasis and antigen-specific regulatory T cells. Trends Immunol. 2008;29(11):532–540. - PubMed
    1. Worbs T, Bode U, Yan S, et al. Oral tolerance originates in the intestinal immune system and relies on antigen carriage by dendritic cells. J Exp Med. 2006;203(3):519–527. - PMC - PubMed
    1. Macpherson AJ, Smith K. Mesenteric lymph nodes at the center of immune anatomy. J Exp Med. 2006;203(3):497–500. - PMC - PubMed
    1. von Boehmer H. Oral tolerance: is it all retinoic acid? J Exp Med. 2007;204(8):1737–1739. - PMC - PubMed
    1. Hori S, Nomura T, Sakaguchi S. Control of regulatory T cell development by the transcription factor Foxp3. Science. 2003;299(5609):1057–1061. - PubMed

Publication types

MeSH terms