. 2010 Sep;51(9):2785-97.
doi: 10.1194/jlr.M008748. Epub 2010 Jun 23.

Subcellular organelle lipidomics in TLR-4-activated macrophages

Affiliations

Subcellular organelle lipidomics in TLR-4-activated macrophages

Alexander Y Andreyev et al. J Lipid Res. 2010 Sep.

Abstract

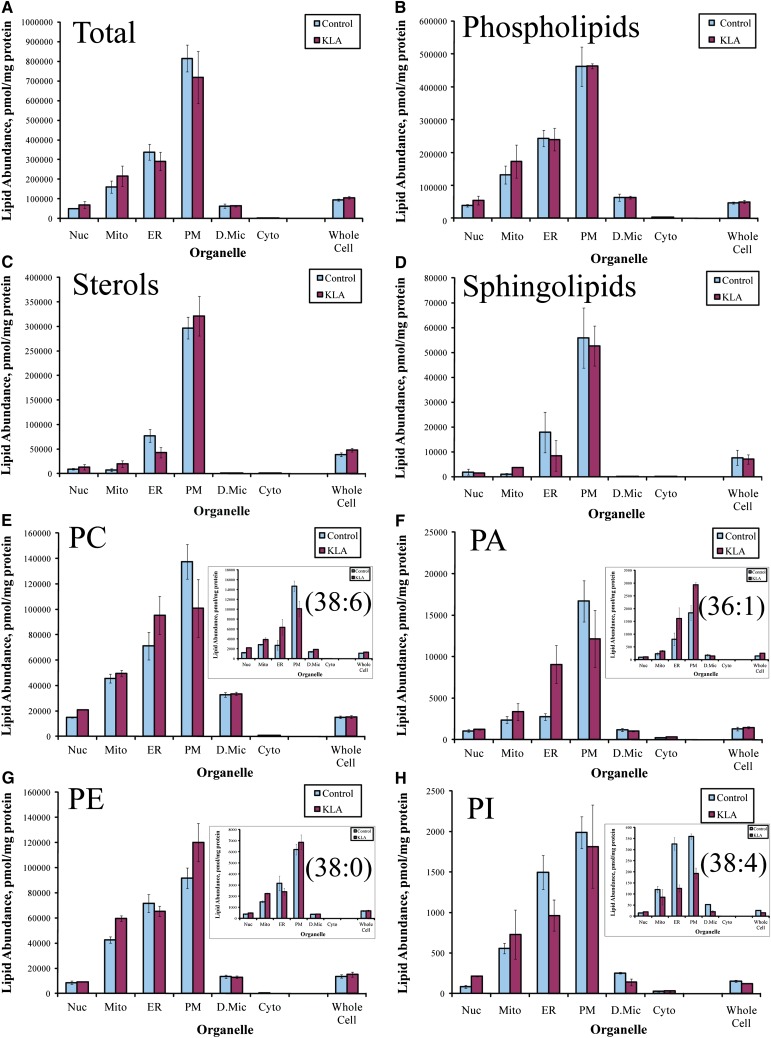
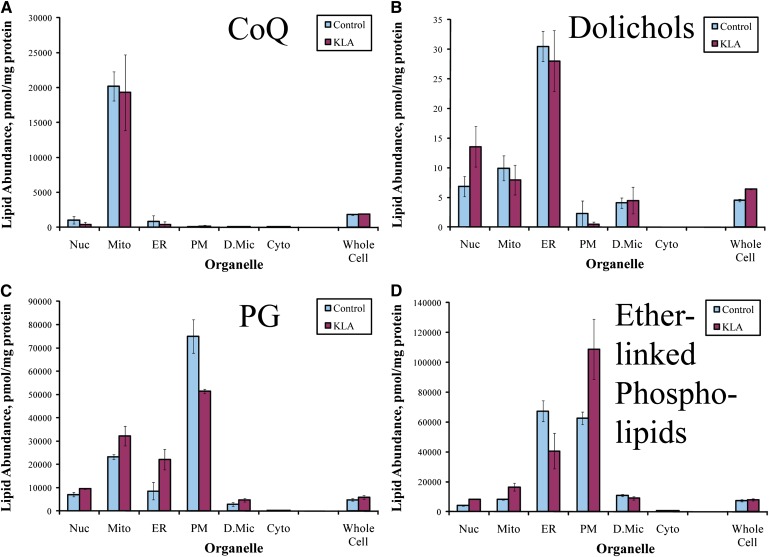
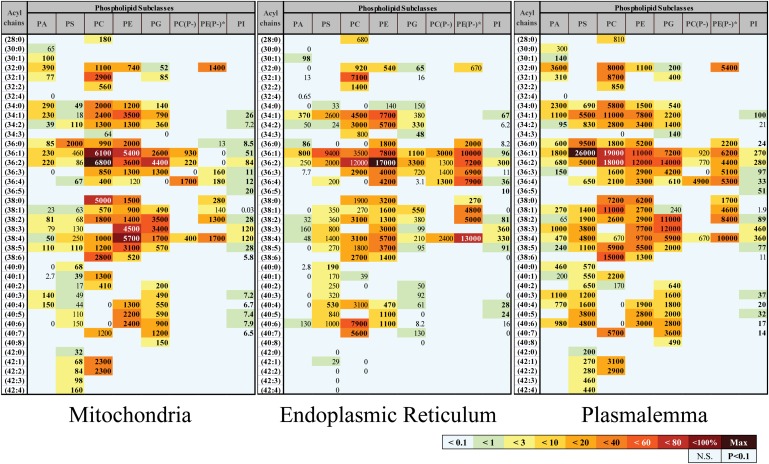
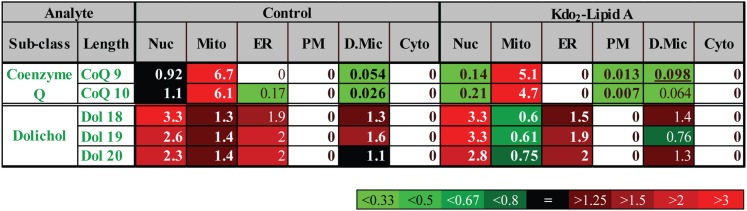
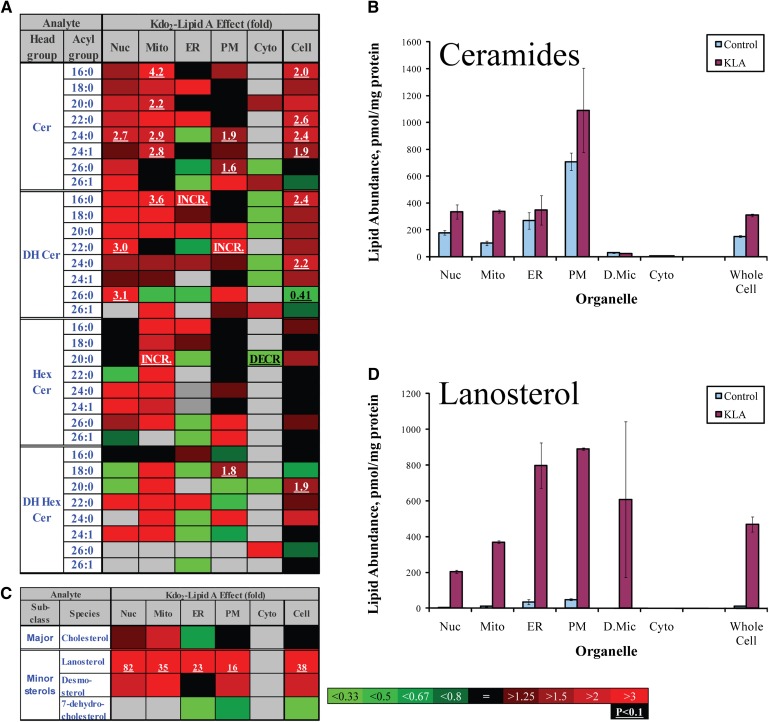
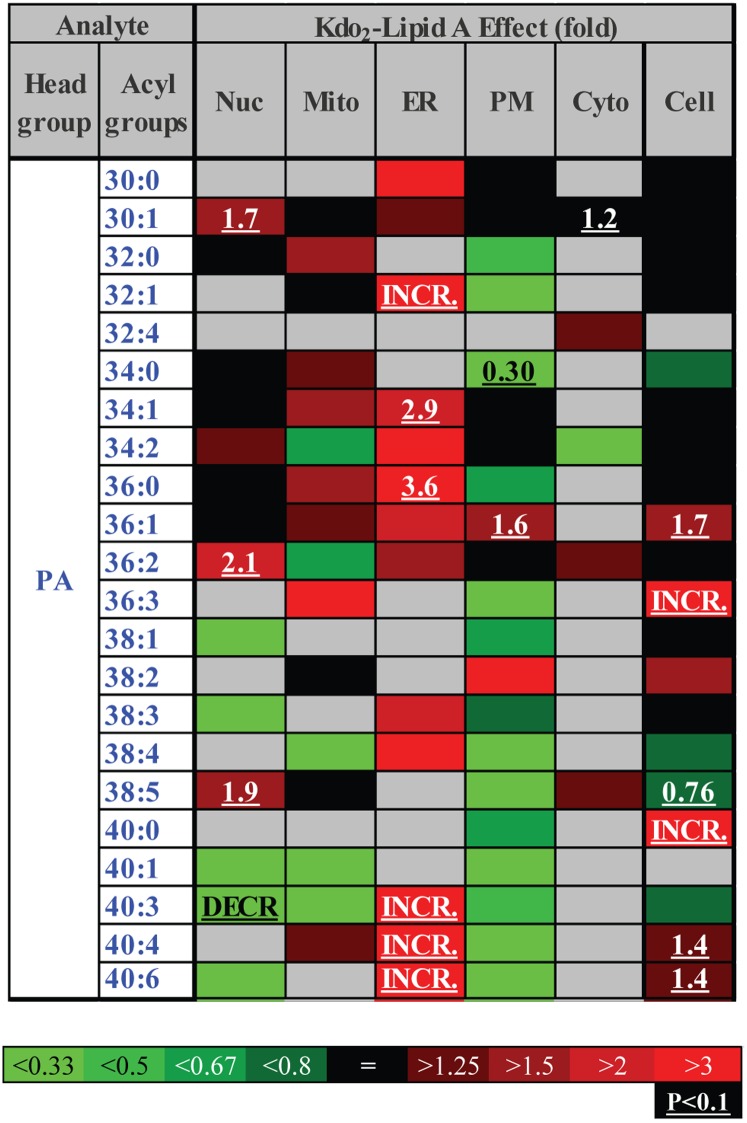
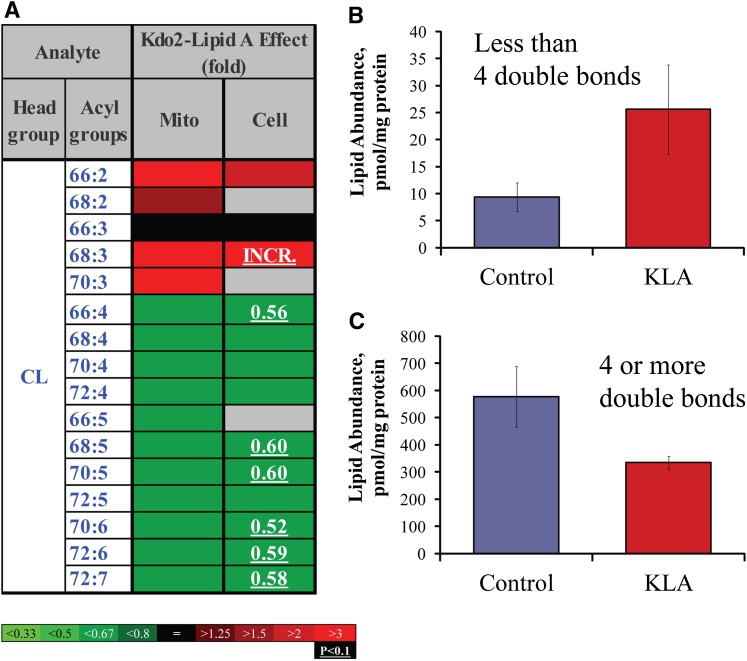
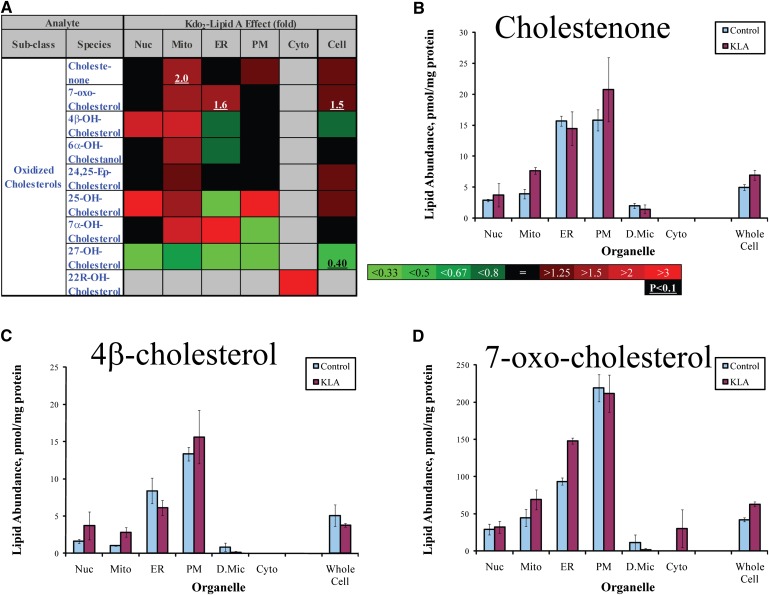
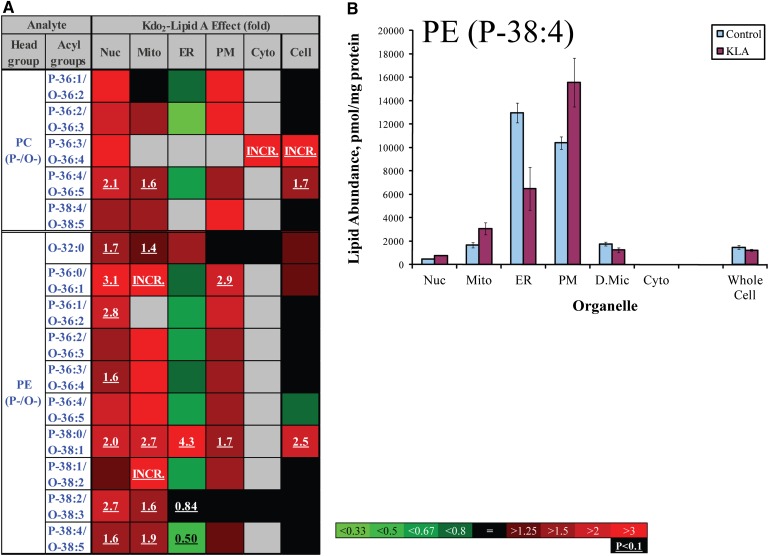
Lipids orchestrate biological processes by acting remotely as signaling molecules or locally as membrane components that modulate protein function. Detailed insight into lipid function requires knowledge of the subcellular localization of individual lipids. We report an analysis of the subcellular lipidome of the mammalian macrophage, a cell type that plays key roles in inflammation, immune responses, and phagocytosis. Nuclei, mitochondria, endoplasmic reticulum (ER), plasmalemma, and cytoplasm were isolated from RAW 264.7 macrophages in basal and activated states. Subsequent lipidomic analyses of major membrane lipid categories identified 229 individual/isobaric species, including 163 glycerophospholipids, 48 sphingolipids, 13 sterols, and 5 prenols. Major subcellular compartments exhibited substantially divergent glycerophospholipid profiles. Activation of macrophages by the Toll-like receptor 4-specific lipopolysaccharide Kdo(2)-lipid A caused significant remodeling of the subcellular lipidome. Some changes in lipid composition occurred in all compartments (e.g., increases in the levels of ceramides and the cholesterol precursors desmosterol and lanosterol). Other changes were manifest in specific organelles. For example, oxidized sterols increased and unsaturated cardiolipins decreased in mitochondria, whereas unsaturated ether-linked phosphatidylethanolamines decreased in the ER. We speculate that these changes may reflect mitochondrial oxidative stress and the release of arachidonic acid from the ER in response to cell activation.


Figures

Fig. 1.
Fig. 1.
Organelle lipid distribution profile (organellar factor). A: Total lipid. B–D: Total glycerophospholipids, sterol lipids, and sphingolipids, respectively. E–H: Total PC, PE, phosphatidic acid (PA), and phosphatidylinositol (PI), respectively (inserts: representative species). Data shown are sums of data for molecular species, mean ± SE, n = 3.
Fig. 2.
Fig. 2.
Subcellular distribution of lipids with specific localization. A: Total CoQ. B: Total dolichol. C: Total phosphatidylglycerol (PG). D: Total ether-linked phospholipids. Nuc, nuclei; Mito, mitochondria; PM, plasmalemma; D.Mic, dense microsomes; Cyto, cytoplasm. Data shown are sums of data for molecular species, mean ± SE, n = 3.
Fig. 3.
Fig. 3.
Glycerophospholipidome of RAW264.7 macrophages is organelle specific. Each box represents an isobaric group; the values are expressed in pmol lipid/mg protein. Geographic map-like color-coding shows the abundance of a given lipid relative to the most abundant lipid species in the organelle; bold font denotes statistical significance. Acyl chains are abbreviated by the numbers of carbon atoms and double bonds per molecule. PA, phosphatidic acid; PG, phosphatidylglycerol; PI, phosphatidylinositol; PC(P-) and PE(P-), plasmenyl/plasmanyl analogs of PC and PE, respectively. *For simplicity, isobaric plasmenyl/plasmanyl species that differ by one double bond in their acyl chains are placed in a single box with the assumption of their plasmenyl nature [except the analyte with acyl chain composition (32:0), which is unequivocally plasmanyl PE (O-32:0)].
Fig. 4.
Fig. 4.
Specificity of localization of prenol lipids. Heat map of coefficient of spatial specificity δ. The numbers show fold-difference between actual lipid species abundance and its predicted value from the whole cell level of the lipid species (species factor) and the amount of total lipid in organelle (organellar factor). Nuc, nuclei; Mito, mitochondria; PM, plasmalemma; D.Mic, dense microsomes; Cyto, cytoplasm.
Fig. 5.
Fig. 5.
Global lipidome changes. A: Ceramide heat map showing fold-increase in response to KLA. Changes are color coded; numbers indicate statistically significant fold-changes. Cer, ceramide, DH, dihydro-, Hex, hexosyl (glucosyl or galactosyl). INCR., increase from zero; DECR., decrease to zero. Acyl groups are abbreviated by the numbers of carbon atoms and double bonds per molecule. B: Increase in total ceramide (sum of individual species is shown). C: Sterol lipids heat map showing fold-increase in response to KLA. D: Increase in lanosterol. Nuc, nuclei, Mito, mitochondria, PM, plasmalemma, D.Mic, dense microsomes, Cyto, cytoplasm. Data (B and D) are mean ± SE, n = 3.
Fig. 6.
Fig. 6.
ER-specific increase in phosphatidic acid (heat map). Each box represents an isobaric group. Changes are color-coded; numbers indicate statistically significant fold-changes. INCR., increase from zero; DECR., decrease to zero; Nuc, nuclei; Mito, mitochondria; PM, plasmalemma; D.Mic, dense microsomes; Cyto, cytoplasm. Acyl groups are abbreviated by the numbers of carbon atoms and double bonds per molecule.
Fig. 7.
Fig. 7.
Shift of CL profile to less unsaturated species. A: Heat map. Each box represents an isobaric group. Changes are color-coded; numbers indicate statistically significant fold-changes. INCR., increase from zero. Acyl groups are abbreviated by the numbers of carbon atoms and double bonds per molecule. Mito, mitochondria. B: Highly unsaturated CLs (four or more double bonds). C: Moderately unsaturated CLs (two or three double bonds). Data (B and C) are mean ± SE, n = 3.
Fig. 8.
Fig. 8.
Location-specific oxysterol increases. A: Heat map. Changes are color-coded; numbers indicate statistically significant fold-changes. Nuc, nuclei; Mito, mitochondria; PM, plasmalemma; D.Mic, dense microsomes; Cyto, cytoplasm. B–E. Cholestenone (increase in mitochondria), 4-β-cholesterol (increase in mitochondria), 7-oxo-cholesterol (increase in ER). Data are mean ± SE, n = 3.
Fig. 9.
Fig. 9.
ER-specific decrease in unsaturated ether-linked lipids. A: Heat map. Each box represents an isobaric group. Changes are color-coded; numbers indicate statistically significant fold changes. INCR., increase from zero. PC (P-/O-), plasmenyl/plasmanyl analogs of PC; PE (P-/O-), plasmenyl/plasmanyl analogs of PE. Acyl groups are abbreviated by the numbers of carbon atoms and double bonds per molecule. Nuc, nuclei; Mito, mitochondria; PM, plasmalemma; D.Mic, dense microsomes; Cyto, cytoplasm. B: Plasmenyl/plasmanyl PE (P-38:4/O-38:5). Data are mean ± SE, n = 3.

References

    1. Wymann M. P., Schneiter R. 2008. Lipid signalling in disease. Nat. Rev. Mol. Cell Biol. 9: 162–176. - PubMed
    1. Hannun Y. A., Obeid L. M. 2008. Principles of bioactive lipid signalling: lessons from sphingolipids. Nat. Rev. Mol. Cell Biol. 9: 139–150. - PubMed
    1. Nicholls D. G. 2006. The physiological regulation of uncoupling proteins. Biochim. Biophys. Acta. 1757: 459–466. - PubMed
    1. Jenkins C. M., Cedars A., Gross R. W. 2009. Eicosanoid signalling pathways in the heart. Cardiovasc. Res. 82: 240–249. - PMC - PubMed
    1. van Meer G., Voelker D. R., Feigenson G. W. 2008. Membrane lipids: where they are and how they behave. Nat. Rev. Mol. Cell Biol. 9: 112–124. - PMC - PubMed

Publication types