. 2010 Jul;256(1):102-10.
doi: 10.1148/radiol.10091772.

Sentinel lymph nodes in the rat: noninvasive photoacoustic and US imaging with a clinical US system

Affiliations

Sentinel lymph nodes in the rat: noninvasive photoacoustic and US imaging with a clinical US system

Todd N Erpelding et al. Radiology. 2010 Jul.

Abstract

Purpose: To evaluate in vivo sentinel lymph node (SLN) mapping by using photoacoustic and ultrasonographic (US) imaging with a modified clinical US imaging system.

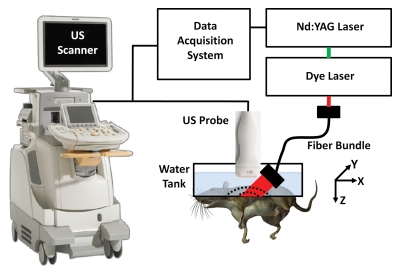
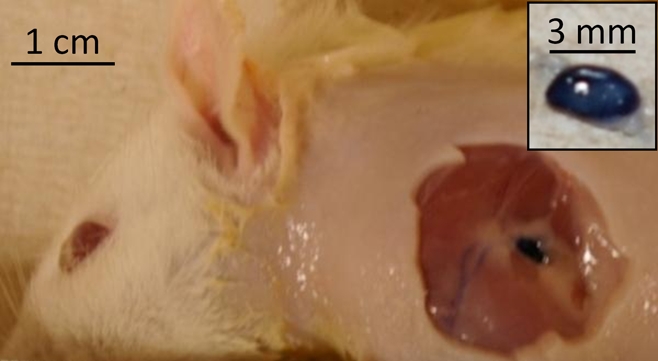
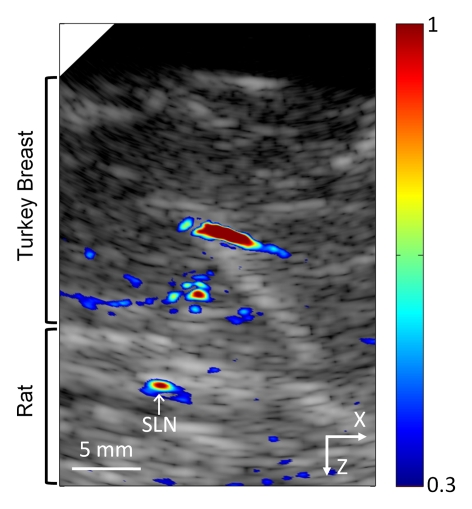
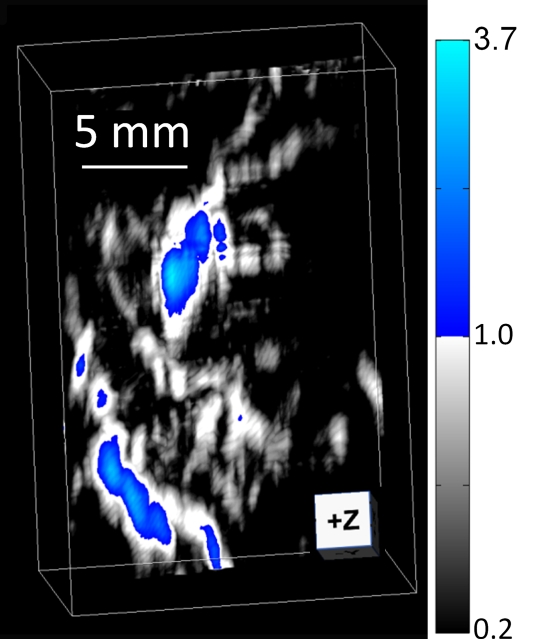
Materials and methods: Animal protocols were approved by the Animal Studies Committee. Methylene blue dye accumulation in axillary lymph nodes of seven healthy Sprague-Dawley rats was imaged by using a photoacoustic imaging system adapted from a clinical US imaging system. To investigate clinical translation, the imaging depth was extended up to 2.5 cm by adding chicken or turkey breast on top of the rat skin surface. Three-dimensional photoacoustic images were acquired by mechanically scanning the US transducer and light delivery fiber bundle along the elevational direction.

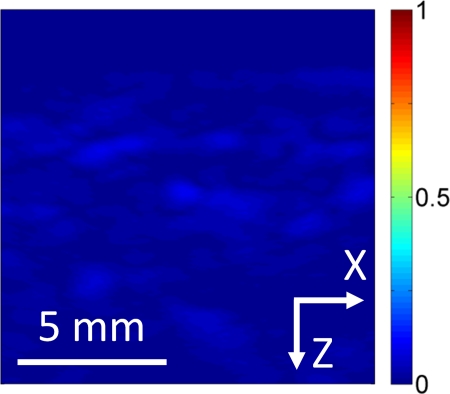
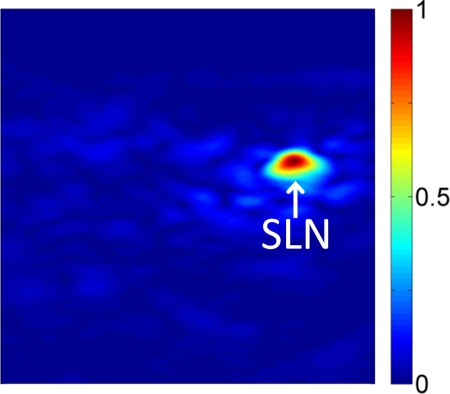
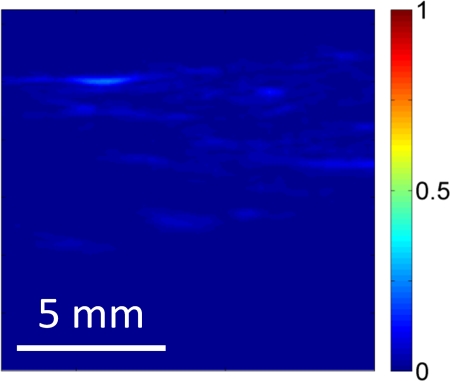
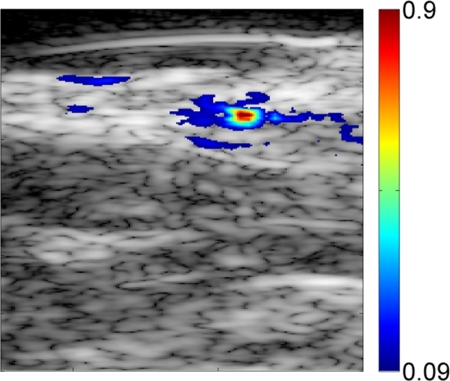
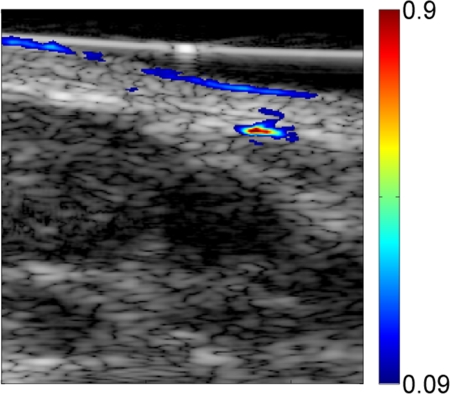
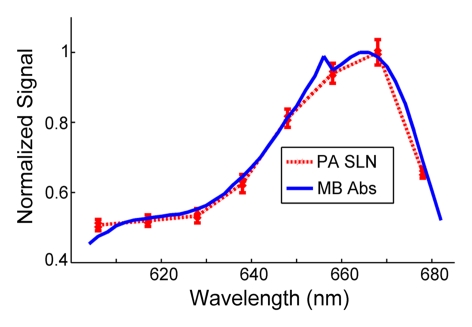
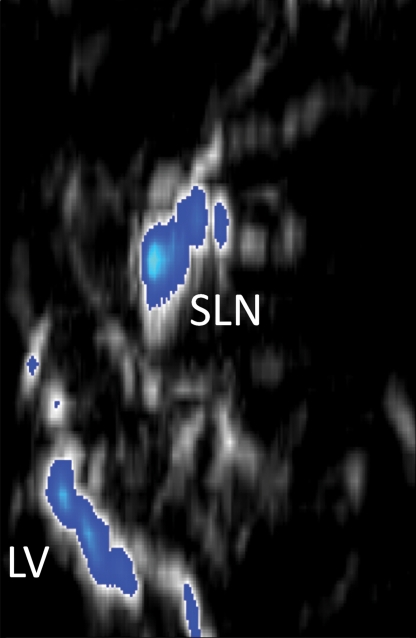
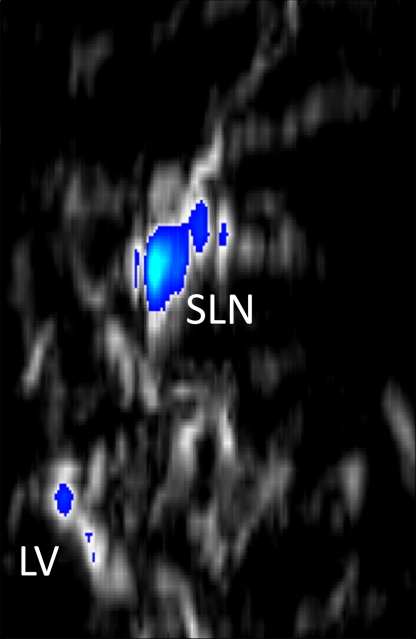
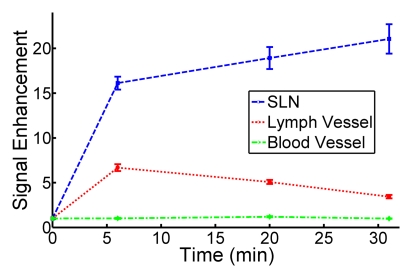
Results: Photoacoustic images of rat SLNs clearly help visualization of methylene blue accumulation, whereas coregistered photoacoustic/US images depict lymph node positions relative to surrounding anatomy. Twenty minutes following methylene blue injection, photoacoustic signals from SLN regions increased nearly 33-fold from baseline signals in preinjection images, and mean contrast between SLNs and background tissue was 76.0 +/- 23.7 (standard deviation). Methylene blue accumulation in SLNs was confirmed photoacoustically by using the optical absorption spectrum of the dye. Three-dimensional photoacoustic images demonstrate dynamic accumulation of methylene blue in SLNs after traveling through lymph vessels.

Conclusion: In vivo photoacoustic and US mapping of SLNs was successfully demonstrated with a modified clinical US scanner. These results raise confidence that photoacoustic and US imaging can be used clinically for accurate, noninvasive imaging of SLNs for axillary lymph node staging in breast cancer patients.


Figures

Figure 1:
Figure 1:
Experimental setup of photoacoustic imaging system adapted from a modified US imaging system. x = X-axis, y = y-axis, z = z-axis.
Figure 2a:
Figure 2a:
Noninvasive photoacoustic B-mode images of SLNs show results from each probe from a different rat acquired in vivo with (a–c) S5-1 probe, (d–f) L8-4 probe, and (g–i) L15-7io probe. (a, d, g) Control photoacoustic images acquired before methylene blue injection. (b, e, h) Photoacoustic images acquired 20 minutes following methylene blue injection. (c, f, i) Coregistered photoacoustic and US images acquired 20 minutes following methylene blue injection. X = x-axis, Z = z-axis.
Figure 2b:
Figure 2b:
Noninvasive photoacoustic B-mode images of SLNs show results from each probe from a different rat acquired in vivo with (a–c) S5-1 probe, (d–f) L8-4 probe, and (g–i) L15-7io probe. (a, d, g) Control photoacoustic images acquired before methylene blue injection. (b, e, h) Photoacoustic images acquired 20 minutes following methylene blue injection. (c, f, i) Coregistered photoacoustic and US images acquired 20 minutes following methylene blue injection. X = x-axis, Z = z-axis.
Figure 2c:
Figure 2c:
Noninvasive photoacoustic B-mode images of SLNs show results from each probe from a different rat acquired in vivo with (a–c) S5-1 probe, (d–f) L8-4 probe, and (g–i) L15-7io probe. (a, d, g) Control photoacoustic images acquired before methylene blue injection. (b, e, h) Photoacoustic images acquired 20 minutes following methylene blue injection. (c, f, i) Coregistered photoacoustic and US images acquired 20 minutes following methylene blue injection. X = x-axis, Z = z-axis.
Figure 2d:
Figure 2d:
Noninvasive photoacoustic B-mode images of SLNs show results from each probe from a different rat acquired in vivo with (a–c) S5-1 probe, (d–f) L8-4 probe, and (g–i) L15-7io probe. (a, d, g) Control photoacoustic images acquired before methylene blue injection. (b, e, h) Photoacoustic images acquired 20 minutes following methylene blue injection. (c, f, i) Coregistered photoacoustic and US images acquired 20 minutes following methylene blue injection. X = x-axis, Z = z-axis.
Figure 2e:
Figure 2e:
Noninvasive photoacoustic B-mode images of SLNs show results from each probe from a different rat acquired in vivo with (a–c) S5-1 probe, (d–f) L8-4 probe, and (g–i) L15-7io probe. (a, d, g) Control photoacoustic images acquired before methylene blue injection. (b, e, h) Photoacoustic images acquired 20 minutes following methylene blue injection. (c, f, i) Coregistered photoacoustic and US images acquired 20 minutes following methylene blue injection. X = x-axis, Z = z-axis.
Figure 2f:
Figure 2f:
Noninvasive photoacoustic B-mode images of SLNs show results from each probe from a different rat acquired in vivo with (a–c) S5-1 probe, (d–f) L8-4 probe, and (g–i) L15-7io probe. (a, d, g) Control photoacoustic images acquired before methylene blue injection. (b, e, h) Photoacoustic images acquired 20 minutes following methylene blue injection. (c, f, i) Coregistered photoacoustic and US images acquired 20 minutes following methylene blue injection. X = x-axis, Z = z-axis.
Figure 2g:
Figure 2g:
Noninvasive photoacoustic B-mode images of SLNs show results from each probe from a different rat acquired in vivo with (a–c) S5-1 probe, (d–f) L8-4 probe, and (g–i) L15-7io probe. (a, d, g) Control photoacoustic images acquired before methylene blue injection. (b, e, h) Photoacoustic images acquired 20 minutes following methylene blue injection. (c, f, i) Coregistered photoacoustic and US images acquired 20 minutes following methylene blue injection. X = x-axis, Z = z-axis.
Figure 2h:
Figure 2h:
Noninvasive photoacoustic B-mode images of SLNs show results from each probe from a different rat acquired in vivo with (a–c) S5-1 probe, (d–f) L8-4 probe, and (g–i) L15-7io probe. (a, d, g) Control photoacoustic images acquired before methylene blue injection. (b, e, h) Photoacoustic images acquired 20 minutes following methylene blue injection. (c, f, i) Coregistered photoacoustic and US images acquired 20 minutes following methylene blue injection. X = x-axis, Z = z-axis.
Figure 2i:
Figure 2i:
Noninvasive photoacoustic B-mode images of SLNs show results from each probe from a different rat acquired in vivo with (a–c) S5-1 probe, (d–f) L8-4 probe, and (g–i) L15-7io probe. (a, d, g) Control photoacoustic images acquired before methylene blue injection. (b, e, h) Photoacoustic images acquired 20 minutes following methylene blue injection. (c, f, i) Coregistered photoacoustic and US images acquired 20 minutes following methylene blue injection. X = x-axis, Z = z-axis.
Figure 3:
Figure 3:
Postmortem photograph of rat acquired after photoacoustic imaging and skin removal. Inset: Dissected SLN stained by using methylene blue. Skin was removed after rat was euthanized and imaging experiments were complete.
Figure 4a:
Figure 4a:
Coregistered photoacoustic and US B-mode images of rat SLNs acquired in vivo with added biologic tissue for increased imaging depth. (a) SLN image acquired with S5-1 probe through additional 2-cm turkey breast 22 minutes following methylene blue injection. X = x-axis, Z = z-axis. (b) Graph shows confirmation of methylene blue accumulation in SLNs by using spectroscopic photoacoustic imaging. Error bars = standard deviation from 30 photoacoustic images collected at each optical wavelength, MB Abs = methylene blue absorption, PA = photoacoustic.
Figure 4b:
Figure 4b:
Coregistered photoacoustic and US B-mode images of rat SLNs acquired in vivo with added biologic tissue for increased imaging depth. (a) SLN image acquired with S5-1 probe through additional 2-cm turkey breast 22 minutes following methylene blue injection. X = x-axis, Z = z-axis. (b) Graph shows confirmation of methylene blue accumulation in SLNs by using spectroscopic photoacoustic imaging. Error bars = standard deviation from 30 photoacoustic images collected at each optical wavelength, MB Abs = methylene blue absorption, PA = photoacoustic.
Figure 5a:
Figure 5a:
In vivo photoacoustic MAP images of rat axillary region. (a) Control photoacoustic MAP image collected prior to methylene blue injection. BV = blood vessel, X = x-axis, Y = y-axis. (b, c, d) Photoacoustic MAP images collected 6, 20, and 31 minutes following methylene blue injection, respectively. Blue color map is used to display signal intensities above the maximum amplitude from the preinjection image. Color bar pertains to images ad. LV = lymph vessel. (e) Volumetric photoacoustic image of rat axilla 20 minutes following methylene blue injection. Z = z-axis. (f) Graph shows dynamic changes in photoacoustic signal amplitudes from SLN, lymph vessel, and blood vessel. Following methylene blue injection, signal intensities from SLN and lymph vessel increase strongly, and over time, the SLN signal continues to increase while lymph vessel signal decreases as methylene blue travels from the lymph vessel and accumulates in the lymph node. No substantial changes were observed in blood vessel signal amplitudes. Error bars = standard deviation from multiple pixels in each region of interest.
Figure 5b:
Figure 5b:
In vivo photoacoustic MAP images of rat axillary region. (a) Control photoacoustic MAP image collected prior to methylene blue injection. BV = blood vessel, X = x-axis, Y = y-axis. (b, c, d) Photoacoustic MAP images collected 6, 20, and 31 minutes following methylene blue injection, respectively. Blue color map is used to display signal intensities above the maximum amplitude from the preinjection image. Color bar pertains to images ad. LV = lymph vessel. (e) Volumetric photoacoustic image of rat axilla 20 minutes following methylene blue injection. Z = z-axis. (f) Graph shows dynamic changes in photoacoustic signal amplitudes from SLN, lymph vessel, and blood vessel. Following methylene blue injection, signal intensities from SLN and lymph vessel increase strongly, and over time, the SLN signal continues to increase while lymph vessel signal decreases as methylene blue travels from the lymph vessel and accumulates in the lymph node. No substantial changes were observed in blood vessel signal amplitudes. Error bars = standard deviation from multiple pixels in each region of interest.
Figure 5c:
Figure 5c:
In vivo photoacoustic MAP images of rat axillary region. (a) Control photoacoustic MAP image collected prior to methylene blue injection. BV = blood vessel, X = x-axis, Y = y-axis. (b, c, d) Photoacoustic MAP images collected 6, 20, and 31 minutes following methylene blue injection, respectively. Blue color map is used to display signal intensities above the maximum amplitude from the preinjection image. Color bar pertains to images ad. LV = lymph vessel. (e) Volumetric photoacoustic image of rat axilla 20 minutes following methylene blue injection. Z = z-axis. (f) Graph shows dynamic changes in photoacoustic signal amplitudes from SLN, lymph vessel, and blood vessel. Following methylene blue injection, signal intensities from SLN and lymph vessel increase strongly, and over time, the SLN signal continues to increase while lymph vessel signal decreases as methylene blue travels from the lymph vessel and accumulates in the lymph node. No substantial changes were observed in blood vessel signal amplitudes. Error bars = standard deviation from multiple pixels in each region of interest.
Figure 5d:
Figure 5d:
In vivo photoacoustic MAP images of rat axillary region. (a) Control photoacoustic MAP image collected prior to methylene blue injection. BV = blood vessel, X = x-axis, Y = y-axis. (b, c, d) Photoacoustic MAP images collected 6, 20, and 31 minutes following methylene blue injection, respectively. Blue color map is used to display signal intensities above the maximum amplitude from the preinjection image. Color bar pertains to images ad. LV = lymph vessel. (e) Volumetric photoacoustic image of rat axilla 20 minutes following methylene blue injection. Z = z-axis. (f) Graph shows dynamic changes in photoacoustic signal amplitudes from SLN, lymph vessel, and blood vessel. Following methylene blue injection, signal intensities from SLN and lymph vessel increase strongly, and over time, the SLN signal continues to increase while lymph vessel signal decreases as methylene blue travels from the lymph vessel and accumulates in the lymph node. No substantial changes were observed in blood vessel signal amplitudes. Error bars = standard deviation from multiple pixels in each region of interest.
Figure 5e:
Figure 5e:
In vivo photoacoustic MAP images of rat axillary region. (a) Control photoacoustic MAP image collected prior to methylene blue injection. BV = blood vessel, X = x-axis, Y = y-axis. (b, c, d) Photoacoustic MAP images collected 6, 20, and 31 minutes following methylene blue injection, respectively. Blue color map is used to display signal intensities above the maximum amplitude from the preinjection image. Color bar pertains to images ad. LV = lymph vessel. (e) Volumetric photoacoustic image of rat axilla 20 minutes following methylene blue injection. Z = z-axis. (f) Graph shows dynamic changes in photoacoustic signal amplitudes from SLN, lymph vessel, and blood vessel. Following methylene blue injection, signal intensities from SLN and lymph vessel increase strongly, and over time, the SLN signal continues to increase while lymph vessel signal decreases as methylene blue travels from the lymph vessel and accumulates in the lymph node. No substantial changes were observed in blood vessel signal amplitudes. Error bars = standard deviation from multiple pixels in each region of interest.
Figure 5f:
Figure 5f:
In vivo photoacoustic MAP images of rat axillary region. (a) Control photoacoustic MAP image collected prior to methylene blue injection. BV = blood vessel, X = x-axis, Y = y-axis. (b, c, d) Photoacoustic MAP images collected 6, 20, and 31 minutes following methylene blue injection, respectively. Blue color map is used to display signal intensities above the maximum amplitude from the preinjection image. Color bar pertains to images ad. LV = lymph vessel. (e) Volumetric photoacoustic image of rat axilla 20 minutes following methylene blue injection. Z = z-axis. (f) Graph shows dynamic changes in photoacoustic signal amplitudes from SLN, lymph vessel, and blood vessel. Following methylene blue injection, signal intensities from SLN and lymph vessel increase strongly, and over time, the SLN signal continues to increase while lymph vessel signal decreases as methylene blue travels from the lymph vessel and accumulates in the lymph node. No substantial changes were observed in blood vessel signal amplitudes. Error bars = standard deviation from multiple pixels in each region of interest.

Similar articles

Cited by

References

    1. Krag DN, Weaver DL, Alex JC, Fairbank JT. Surgical resection and radiolocalization of the sentinel lymph node in breast cancer using a gamma probe. Surg Oncol 1993;2(6):335–339; discussion 340 - PubMed
    1. Giuliano AE, Kirgan DM, Guenther JM, Morton DL. Lymphatic mapping and sentinel lymphadenectomy for breast cancer. Ann Surg 1994;220(3):391–398; discussion 398–401 - PMC - PubMed
    1. Albertini JJ, Lyman GH, Cox C, et al. Lymphatic mapping and sentinel node biopsy in the patient with breast cancer. JAMA 1996;276(22):1818–1822 - PubMed
    1. Krag D, Weaver D, Ashikaga T, et al. The sentinel node in breast cancer: a multicenter validation study. N Engl J Med 1998;339(14):941–946 - PubMed
    1. Kim T, Giuliano AE, Lyman GH. Lymphatic mapping and sentinel lymph node biopsy in early-stage breast carcinoma: a metaanalysis. Cancer 2006;106(1):4–16 - PubMed

LinkOut - more resources