. 2010 Sep;24(9):1641-55.
doi: 10.1038/leu.2010.138. Epub 2010 Jun 24.

The de-ubiquitinase UCH-L1 is an oncogene that drives the development of lymphoma in vivo by deregulating PHLPP1 and Akt signaling

Affiliations

The de-ubiquitinase UCH-L1 is an oncogene that drives the development of lymphoma in vivo by deregulating PHLPP1 and Akt signaling

S Hussain et al. Leukemia. 2010 Sep.

Abstract

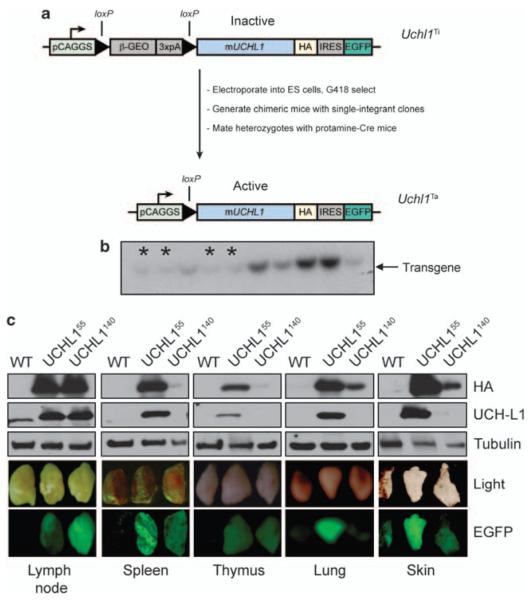
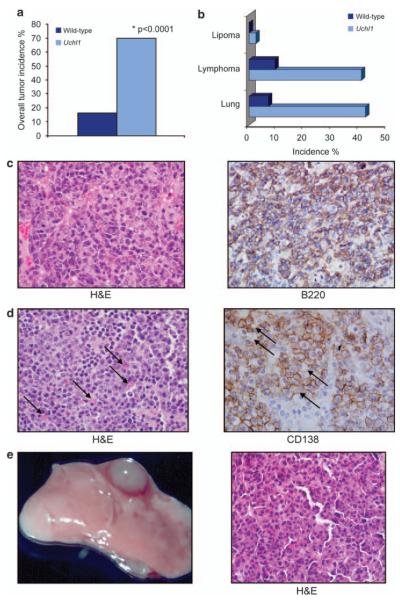
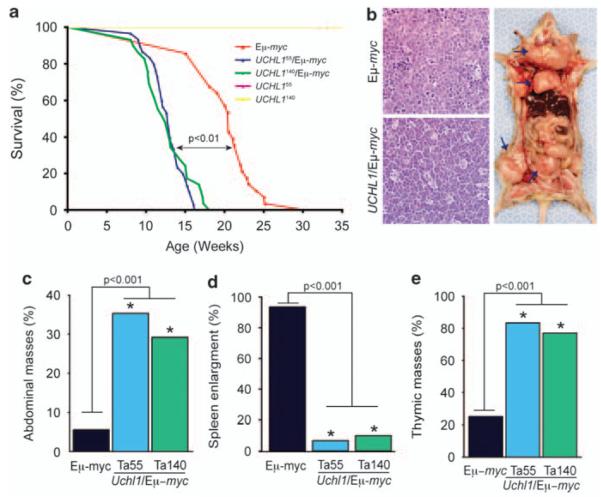
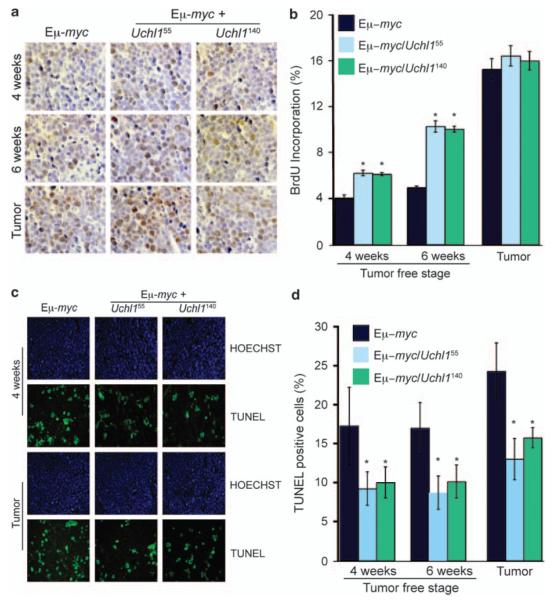
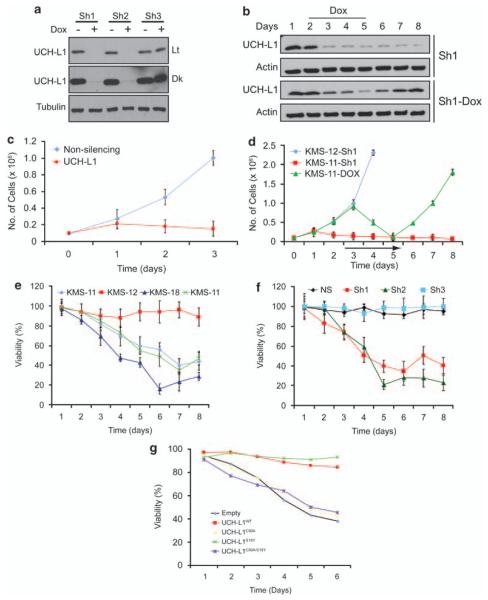
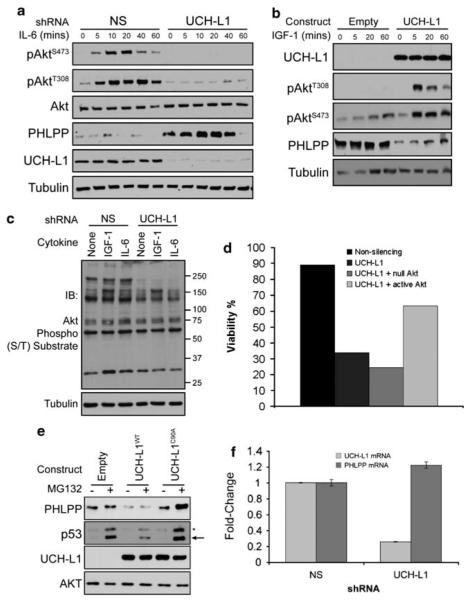
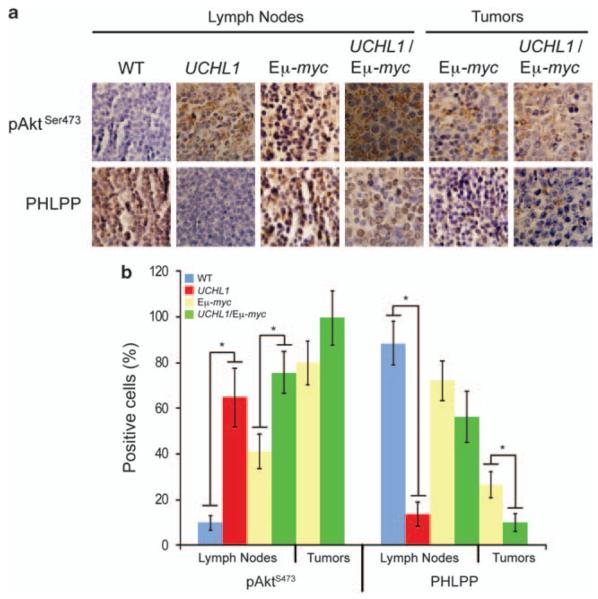
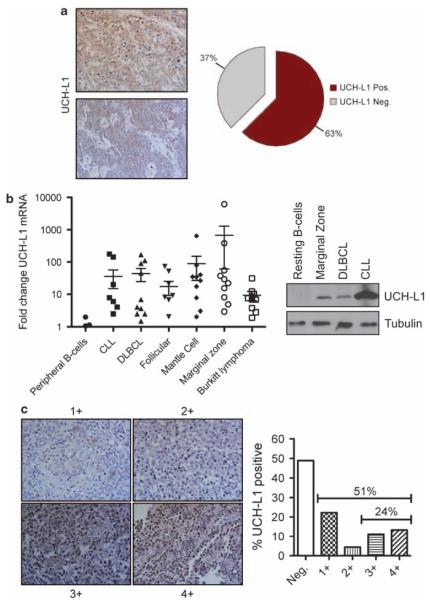
De-ubiquitinating enzymes (DUBs) can reverse the modifications catalyzed by ubiquitin ligases and as such are believed to be important regulators of a variety of cellular processes. Several members of this protein family have been associated with human cancers; however, there is little evidence for a direct link between deregulated de-ubiquitination and neoplastic transformation. Ubiquitin C-terminal hydrolase (UCH)-L1 is a DUB of unknown function that is overexpressed in several human cancers, but whether it has oncogenic properties has not been established. To address this issue, we generated mice that overexpress UCH-L1 under the control of a ubiquitous promoter. Here, we show that UCH-L1 transgenic mice are prone to malignancy, primarily lymphomas and lung tumors. Furthermore, UCH-L1 overexpression strongly accelerated lymphomagenesis in Emu-myc transgenic mice. Aberrantly expressed UCH-L1 boosts signaling through the Akt pathway by downregulating the antagonistic phosphatase PHLPP1, an event that requires its de-ubiquitinase activity. These data provide the first in vivo evidence for DUB-driven oncogenesis and suggest that UCH-L1 hyperactivity deregulates normal Akt signaling.


Figures

Figure 1
Figure 1
Generation of Uchl1 mice. (a) Schematic overview of the generation of Uchl1transgenic mice. (b) Representative southern blot of G418-resistant ES cell clones with indicated single integrant clones marked with an asterisk (*). The other darker bands likely represent clones with multiple integrations. (c) Expression of UCH-L1 in selected tissues as shown by the presence of EGFP and by immunoblotting for HA or UCH-L1. Results are representative of three independent experiments from three pairs of mice. Abbreviations: b-geo, beta-galactosidase/Neomycin resistance fusion protein; EGFP, enhanced green fluorescent protein; HA, hemagglutinin tag; IRES, internal ribosome entry site; PCAGGS, chicken actin promoter; 3XpA, polyadenylation sequence.
Figure 2
Figure 2
UCH-L1 acts as an oncogene in mice. (a) Uchl1 (n = 34; mean age 17.3 months) and wild-type littermates (n = 43; mean age = 17.9 months) were killed and dissected for tumors. The overall incidence of all tumor types is indicated. (b) The spectrum and individual incidence of tumor types observed in (a). (c) Representative lymphoma from an Uchl1 mouse, staining as indicated. The mass is comprised of dense sheets of large lymphocytes with abundant cytoplasm, oval nuclei and a vesicular chromatin pattern. There is prominent anisokaryosis and mitotic figures are abundant. The neoplastic lymphocytes stain positively with the B220 antibody. (d) Representative plasmacytoma from an Uchl1 mouse with staining as indicated. The mass consists of sheets of medium-sized plasma cells characterized by moderate amphophilic cytoplasm and an eccentric round nucleus and marginated chromatin. Some cells contain large, homogenous eosinophilic inclusions (Russell bodies; indicated by arrowheads). Admixed with the plasma cells are lymphoblastic cells. (e) Gross and histological views of representative bronchiolo-alveolar carcinoma seen in an Uchl1 mouse. The mass is comprised of large polygonal type II pneumocytes lining a delicate network of papillary connective tissue. Neoplastic pneumocytes often pile up and destroy the alveolar septae, and occasionally invade the bronchiolar walls. There is increased cytoplasmic basophilia and moderate anisokaryosis.
Figure 3
Figure 3
UCH-L1 accelerates the development of lymphoma in Eμ-myc mice. (a) Survival curves for Uchl1, Eμ-myc and Uchl1/Eμ-myc mice. Please note that the survival curve for clone 55 is not visible, as it is superimposed by that of clone 140, with 100% survival through the course of this experiment. P value represents the results of the log-rank test. (b) Histology of tumors from the indicated genotypes. Representative image of an Uchl1/Eμ-myc mouse with lymphoma. Similar results were seen in four separate masses from separate animals. Arrows indicate (from top to bottom) enlarged lymph nodes, thymic mass and an abdominal mass. (c–e) Graphs depicting the incidence of abdominal masses (c), splenic enlargement (d) and thymic involvement (e). Ta55 and Ta140 indicate Uchl1 mice from clones 55 and 140, respectively. n = 30 mice for all groups. P values represent results from the χ2 test.
Figure 4
Figure 4
UCH-L1 enhances proliferation and suppresses apoptosis in pre-malignant tissues. (a, b) Mice at 4 weeks, 6 weeks or those with tumors were killed and analyzed for cell proliferation. Mice of the indicated genotypes were injected with BrdU and killed 6 h later. BrdU incorporation was assessed by immunohistochemistry (a). Quantitation (b) reflects the average percentage of BrdU-positive cells in 10 random fields. Images are representative. (c, d) Tissues from the same samples as in (a, b) were analyzed using the TUNEL assay using immunofluorescence (c). Quantitation (d) reflects the average numbers of TUNEL-positive cells in 10 random fields. Data and statistics for all panels reflect the results from tissues from three mice per genotype. *P<0.05 (chi-square).
Figure 5
Figure 5
UCH-L1 is required for the survival of UCH-L1-expressing malignant B-cells. (a) KMS-11 cells transduced with the indicated Dox-inducible constructs were incubated with Dox for 5 days and then assayed for knockdown by immunoblotting. The blots shown are representative of more than three independent experiments. (b) KMS-11 cells transduced with the indicated shRNA constructs were sampled on the indicated days for expression of UCH-L1 by immunoblotting. Doxycycline was included on the indicated days. Protein loading was controlled by actin. (c) KMS-11 cells were transduced with the indicated shRNA constructs and selected as above. Cell numbers were determined by trypan blue exclusion at the indicated times. (d) KMS-11 or KMS-12 cells were transduced with the indicated shRNA constructs, and cell numbers were determined as in (c). Doxycycline was included on days 3 through 5 as indicated by the black line. (e) The indicated cell lines were transduced with the Sh1-construct and viability was determined by MTS assay. (f) KMS-28 cells were transduced with the indicated shRNA constructs and selected with puromycin. Viability, as determined by MTS assay, was determined in triplicate on the indicated day and results for non-silencing shRNA were set at 100%. (g) KMS-28 cells transduced with DOX-inducible Sh1 were transduced with the indicated shRNA-resistant UCH-L1 constructs, and then incubated in doxycycline to deplete endogenous UCH-L1. Viability was monitored daily by the MTS assay. Time is expressed as days in doxycycline. All growth curves and viability assays were performed in triplicate and were performed on at least three independent occasions. Abbreviations: Dk, dark; Lt, light exposure; NS, non-silencing shRNA; Sh1 = UCH-L1 targeting construct 1; Sh2 = UCH-L1 targeting construct 2.
Figure 6
Figure 6
UCH-L1 expression leads to enhanced Akt signaling in vitro. (a) KMS-28 cells transduced with either control (NS) or the UCH-L1 targeting Sh1 construct were serum starved and stimulated with 10 ng/ml interleukin-6 (IL-6) for the indicated times. Extracts were immuno-blotted for the indicated proteins. (b) HeLa cells were transduced with empty lentivirus (empty) or virus encoding wild-type UCH-L1 and stimulated with 50 ng/ml insulin-like growth factor-1 (IGF-1). Extracts were immuno-blotted for the indicated proteins. (c) KMS-28 cells were transduced with the indicated shRNA constructs and stimulated with the indicated cytokine. Extracts were blotted for phospho-S/T Akt substrates as indicated (d) KMS-28 cells stably transduced with doxycycline-inducible non-silencing, or UCH-L1 targeting shRNAs were transduced with either null Akt (AktT308A/S473A) or constitutively active Akt (myr-Akt). Following the addition of doxycycline, cells were monitored daily for viability with the MTS assay. The results shown were obtained in triplicate on day 6. (e) HeLa cells transduced with either virus or those encoding wild-type UCH-L1 or catalytic mutant UCH-L1 (C90A) were prepared as in (b) without the addition of cytokine. Empty or Sh1 knockdown constructs were incubated with MG132 for 2 h, followed by immunoblotting for the indicated proteins. Extracts were immuno-blotted with the indicated proteins. p53 accumulation confirms proteasome inhibition. Asterisk denotes a non-specific band. The relative decrease in p53 levels seen with UCH-L1WT is not reproducible. (f) PHLPP mRNA was measured by qRT-PCR. RNA was extracted from cells transduced with the indicated shRNA following overnight serum starvation. All reactions were performed in triplicate and values were normalized to those of tata-binding protein (TBP). All immunoblots are representative of at least three independent experiments. qRT-PCR was performed on two independent occasions with similar results. The P-value comparing the levels in non-silencing to UCH-L1 shRNA is >0.05.
Figure 7
Figure 7
Akt phosphorylation is enhanced in vivo in response to UCH-L1 expression. (a) The indicated tissue sections were prepared from either wild-type or Uchl1 mice. The images are representative of fields. Immunohistochemistry was performed with antibodies targeting pS473 or PHLPP as indicated. (b) Quantitation of immunohistochemistry performed in a. Immunohistochemistry was performed on tissues from three independent mice of each genotype. Values reflect the average percentage of positive cells in 10 random fields from each mouse. Error bars represent the standard deviation. Asterisk denotes P<0.05 by the chi-square test.
Figure 8
Figure 8
Increased UCH-L1 expression is highly prevalent in human B-cell cancers. (a) UCH-L1 was detected in a panel of 24 primary Burkitt’s lymphoma samples by immunohistochemistry. Two UCH-L1-positive samples are shown along with a graph showing the prevalence of UCH-L1 expression. Only those samples with widespread immunoreactivity were considered positive. (b) UCH-L1 mRNA was measured from a panel of 59 primary human samples, of the indicated histological subtypes, by quantitative real-time PCR and compared with values obtained from a panel of peripheral B-cells purified from eight healthy donors. All values were obtained in triplicate and were normalized to levels of the housekeeping gene tata-binding protein (TBP). (b) Immunoblot of UCH-L1 expression at the protein level in selected primary samples from (a). Results are representative of two independent experiments. (c) Immunohistochemical staining for UCH-L1 in a B-cell lymphoma tissue microarray (n = 45 cases, unrelated to those in (a) or (b)). All cases were quantified based on a scale ranging from negative (no staining) to 4 + (widespread staining).

Similar articles

Cited by

References

    1. Hoeller D, Hecker CM, Dikic I. Ubiquitin and ubiquitin-like proteins in cancer pathogenesis. Nat Rev Cancer. 2006;6:776–788. - PubMed
    1. Glickman MH, Ciechanover A. The ubiquitin-proteasome proteolytic pathway: destruction for the sake of construction. Physiol Rev. 2002;82:373–428. - PubMed
    1. Nijman SM, Luna-Vargas MP, Velds A, Brummelkamp TR, Dirac AM, Sixma TK, et al. A genomic and functional inventory of deubiquitinating enzymes. Cell. 2005;123:773–786. - PubMed
    1. Schmitz R, Hansmann ML, Bohle V, Martin-Subero JI, Hartmann S, Mechtersheimer G, et al. TNFAIP3 (A20) is a tumor suppressor gene in Hodgkin lymphoma and primary mediastinal B cell lymphoma. J Exp Med. 2009;206:981–989. - PMC - PubMed
    1. Novak U, Rinaldi A, Kwee I, Nandula SV, Rancoita PM, Compagno M, et al. The NF-\{kappa\}B negative regulator TNFAIP3 (A20) is inactivated by somatic mutations and genomic deletions in marginal zone lymphomas. Blood. 2009;113:4918–4921. - PMC - PubMed

Publication types