

Systematic analysis of cis-elements in unstable mRNAs demonstrates that CUGBP1 is a key regulator of mRNA decay in muscle cells
- PMID: 20574513
- PMCID: PMC2888570
- DOI: 10.1371/journal.pone.0011201
Systematic analysis of cis-elements in unstable mRNAs demonstrates that CUGBP1 is a key regulator of mRNA decay in muscle cells
Abstract
Background: Dramatic changes in gene expression occur in response to extracellular stimuli and during differentiation. Although transcriptional effects are important, alterations in mRNA decay also play a major role in achieving rapid and massive changes in mRNA abundance. Moreover, just as transcription factor activity varies between different cell types, the factors influencing mRNA decay are also cell-type specific.
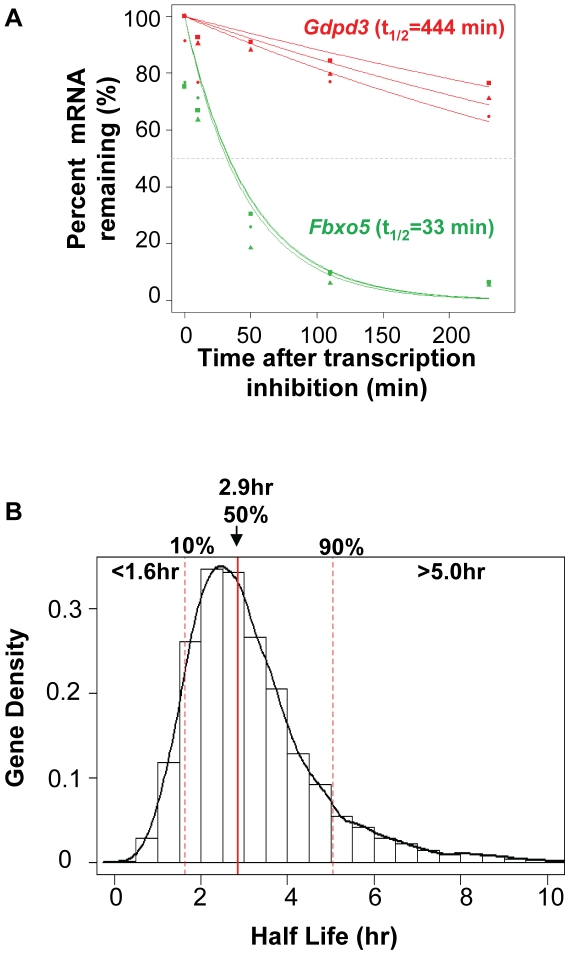
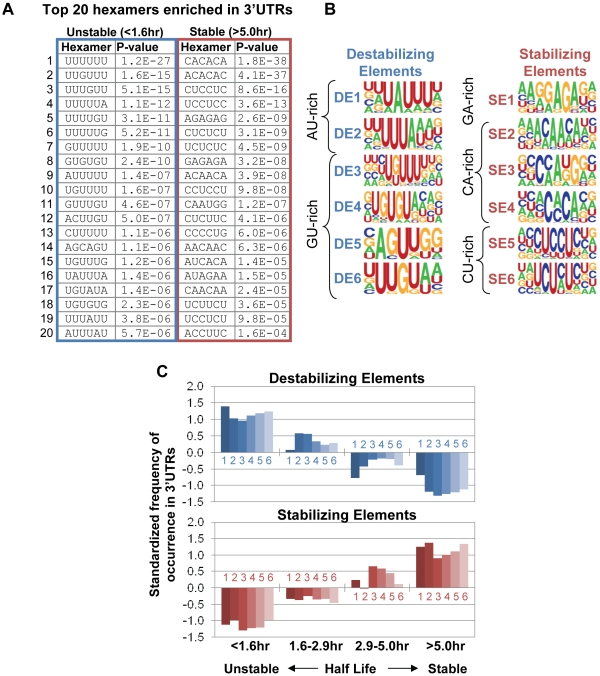
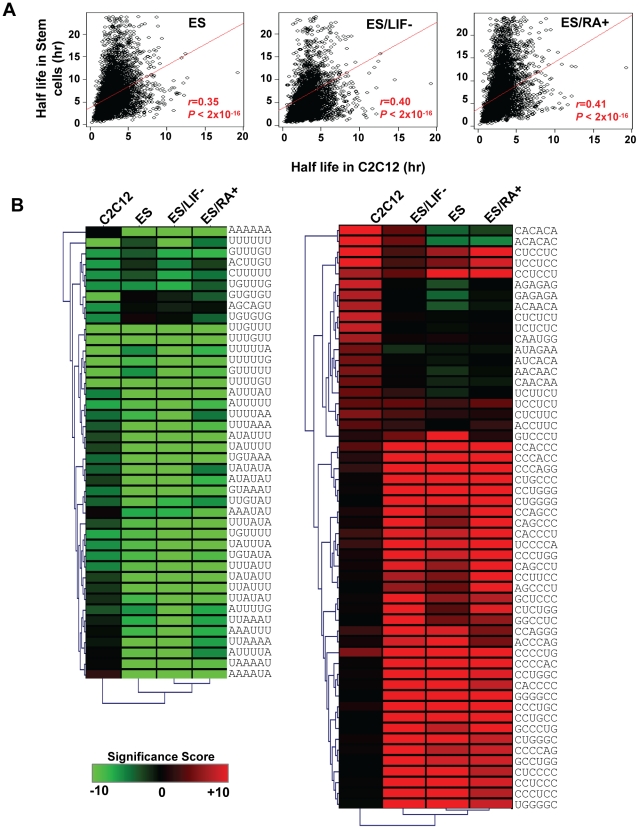
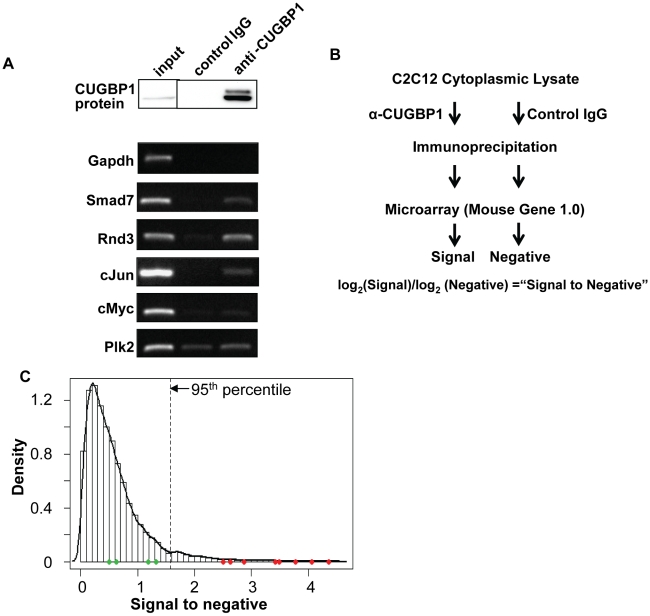
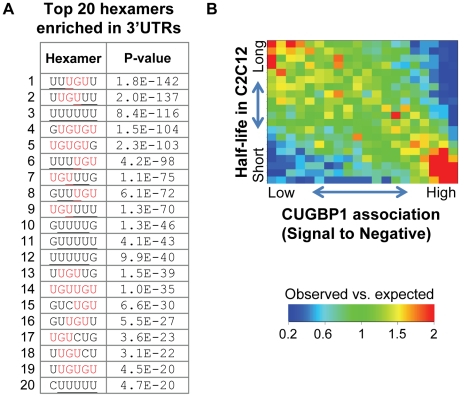
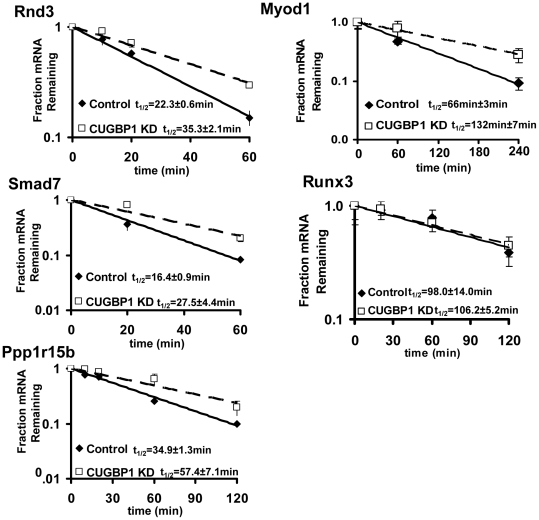
Principal findings: We have established the rates of decay for over 7000 transcripts expressed in mouse C2C12 myoblasts. We found that GU-rich (GRE) and AU-rich (ARE) elements are over-represented in the 3'UTRs of short-lived mRNAs and that these mRNAs tend to encode factors involved in cell cycle and transcription regulation. Stabilizing elements were also identified. By comparing mRNA decay rates in C2C12 cells with those previously measured for pluripotent and differentiating embryonic stem (ES) cells, we identified several groups of transcripts that exhibit cell-type specific decay rates. Further, whereas in C2C12 cells the impact of GREs on mRNA decay appears to be greater than that of AREs, AREs are more significant in ES cells, supporting the idea that cis elements make a cell-specific contribution to mRNA stability. GREs are recognized by CUGBP1, an RNA-binding protein and instability factor whose function is affected in several neuromuscular diseases. We therefore utilized RNA immunoprecipitation followed by microarray (RIP-Chip) to identify CUGBP1-associated transcripts. These mRNAs also showed dramatic enrichment of GREs in their 3'UTRs and encode proteins linked with cell cycle, and intracellular transport. Interestingly several CUGBP1 substrate mRNAs, including those encoding the myogenic transcription factors Myod1 and Myog, are also bound by the stabilizing factor HuR in C2C12 cells. Finally, we show that several CUGBP1-associated mRNAs containing 3'UTR GREs, including Myod1, are stabilized in cells depleted of CUGBP1, consistent with the role of CUGBP1 as a destabilizing factor.
Conclusions: Taken together, our results systematically establish cis-acting determinants of mRNA decay rates in C2C12 myoblast cells and demonstrate that CUGBP1 associates with GREs to regulate decay of a wide range of mRNAs including several that are critical for muscle development.
Conflict of interest statement
Figures
Similar articles
-
Analysis of CUGBP1 targets identifies GU-repeat sequences that mediate rapid mRNA decay.Mol Cell Biol. 2010 Aug;30(16):3970-80. doi: 10.1128/MCB.00624-10. Epub 2010 Jun 14. Mol Cell Biol. 2010. PMID: 20547756 Free PMC article.
-
Correlation between intrinsic mRNA stability and the affinity of AUF1 (hnRNP D) and HuR for A+U-rich mRNAs.Mol Cell Biochem. 2002 Mar;232(1-2):1-11. doi: 10.1023/a:1014819016552. Mol Cell Biochem. 2002. PMID: 12030365
-
RNAi-mediated HuR depletion leads to the inhibition of muscle cell differentiation.J Biol Chem. 2003 Nov 21;278(47):47119-28. doi: 10.1074/jbc.M308889200. Epub 2003 Aug 27. J Biol Chem. 2003. PMID: 12944397
-
Coordinate regulation of mRNA decay networks by GU-rich elements and CELF1.Curr Opin Genet Dev. 2011 Aug;21(4):444-51. doi: 10.1016/j.gde.2011.03.002. Epub 2011 Apr 13. Curr Opin Genet Dev. 2011. PMID: 21497082 Free PMC article. Review.
-
HuR and mRNA stability.Cell Mol Life Sci. 2001 Feb;58(2):266-77. doi: 10.1007/PL00000854. Cell Mol Life Sci. 2001. PMID: 11289308 Free PMC article. Review.
Cited by
-
Identification of CELF1 RNA targets by CLIP-seq in human HeLa cells.Genom Data. 2016 Apr 19;8:97-103. doi: 10.1016/j.gdata.2016.04.009. eCollection 2016 Jun. Genom Data. 2016. PMID: 27222809 Free PMC article.
-
CELFish ways to modulate mRNA decay.Biochim Biophys Acta. 2013 Jun-Jul;1829(6-7):695-707. doi: 10.1016/j.bbagrm.2013.01.001. Epub 2013 Jan 15. Biochim Biophys Acta. 2013. PMID: 23328451 Free PMC article. Review.
-
Alternative polyadenylation of mRNA precursors.Nat Rev Mol Cell Biol. 2017 Jan;18(1):18-30. doi: 10.1038/nrm.2016.116. Epub 2016 Sep 28. Nat Rev Mol Cell Biol. 2017. PMID: 27677860 Free PMC article. Review.
-
Molecular mechanisms of muscle atrophy in myotonic dystrophies.Int J Biochem Cell Biol. 2013 Oct;45(10):2280-7. doi: 10.1016/j.biocel.2013.06.010. Epub 2013 Jun 21. Int J Biochem Cell Biol. 2013. PMID: 23796888 Free PMC article. Review.
-
Evaluating the effects of CELF1 deficiency in a mouse model of RNA toxicity.Hum Mol Genet. 2014 Jan 15;23(2):293-302. doi: 10.1093/hmg/ddt419. Epub 2013 Sep 2. Hum Mol Genet. 2014. PMID: 24001600 Free PMC article.
References
-
- Shen X, Collier JM, Hlaing M, Zhang L, Delshad EH, et al. Genome-wide examination of myoblast cell cycle withdrawal during differentiation. Dev Dyn. 2003;226:128–138. - PubMed
Publication types
MeSH terms
Substances
Associated data
- Actions
Grants and funding
LinkOut - more resources
Full Text Sources
Molecular Biology Databases
Miscellaneous
