. 2010 Jun 21;5(6):e11015.
doi: 10.1371/journal.pone.0011015.

The early nutritional environment of mice determines the capacity for adipose tissue expansion by modulating genes of caveolae structure

Affiliations

The early nutritional environment of mice determines the capacity for adipose tissue expansion by modulating genes of caveolae structure

Leslie P Kozak et al. PLoS One. .

Abstract

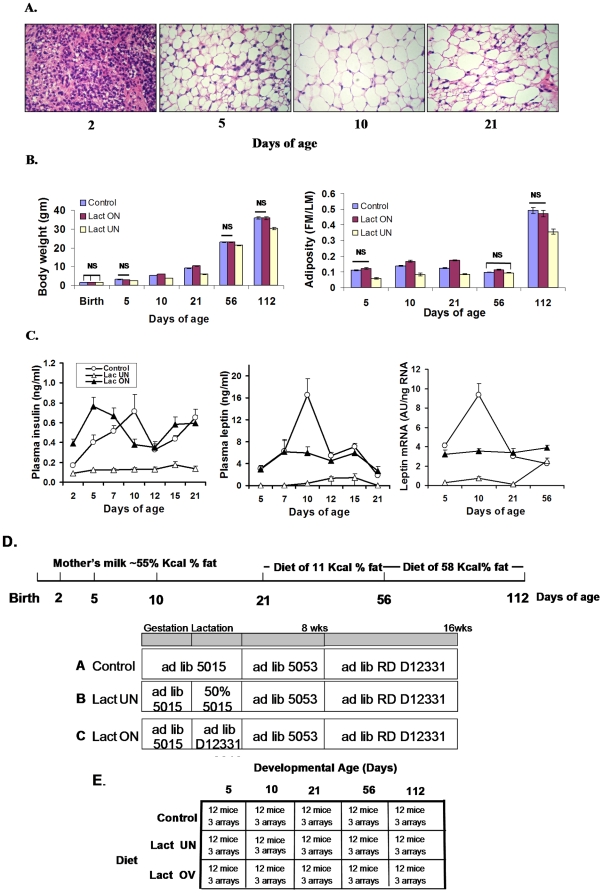
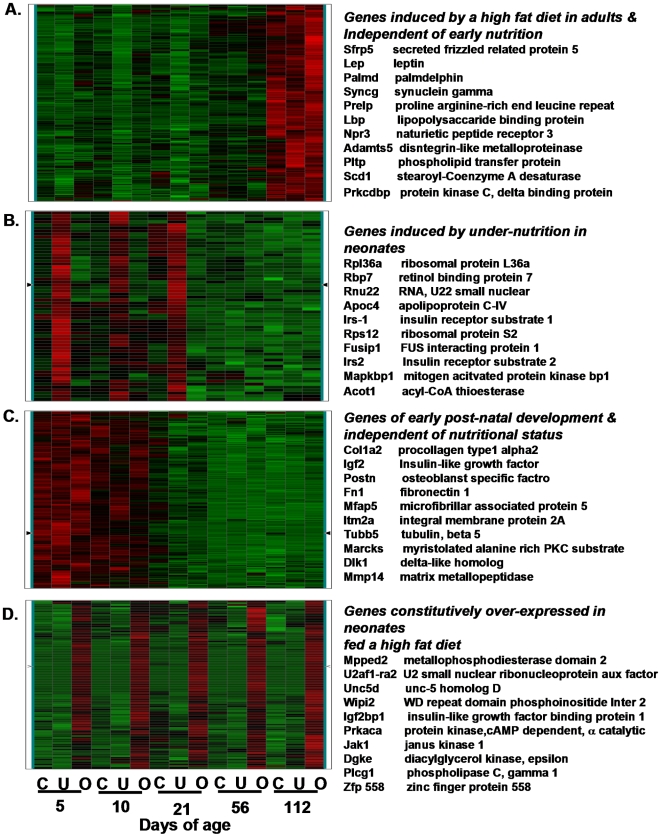
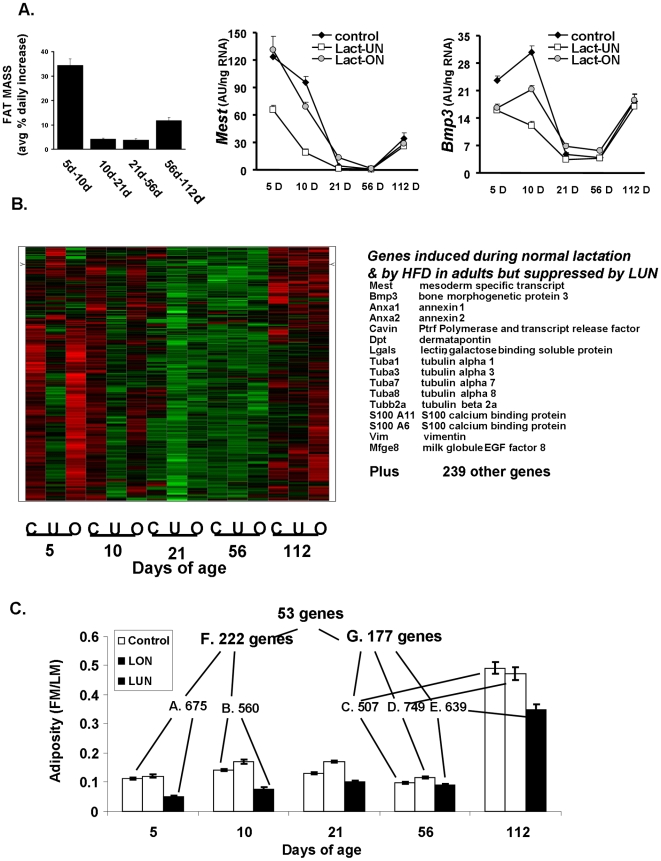
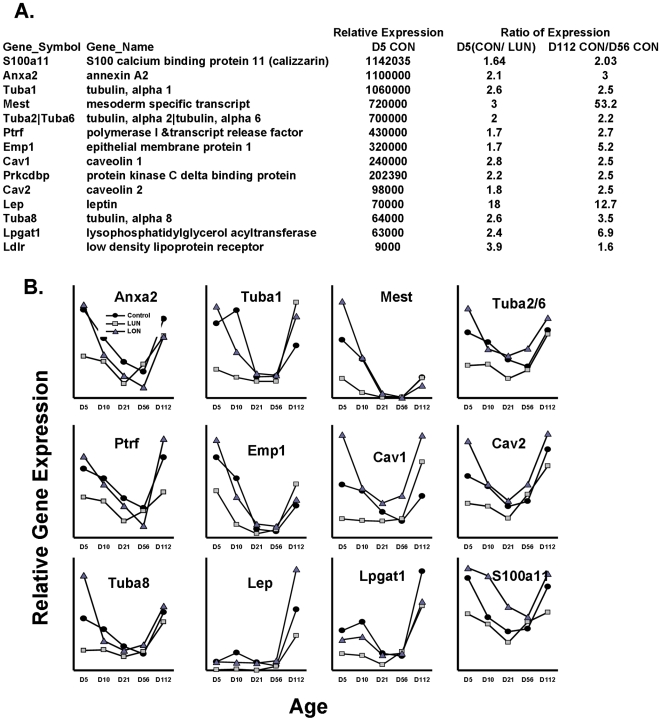
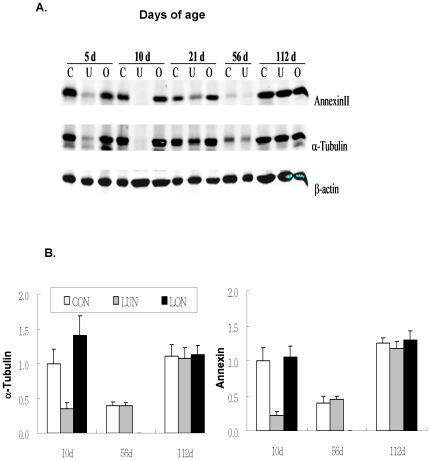
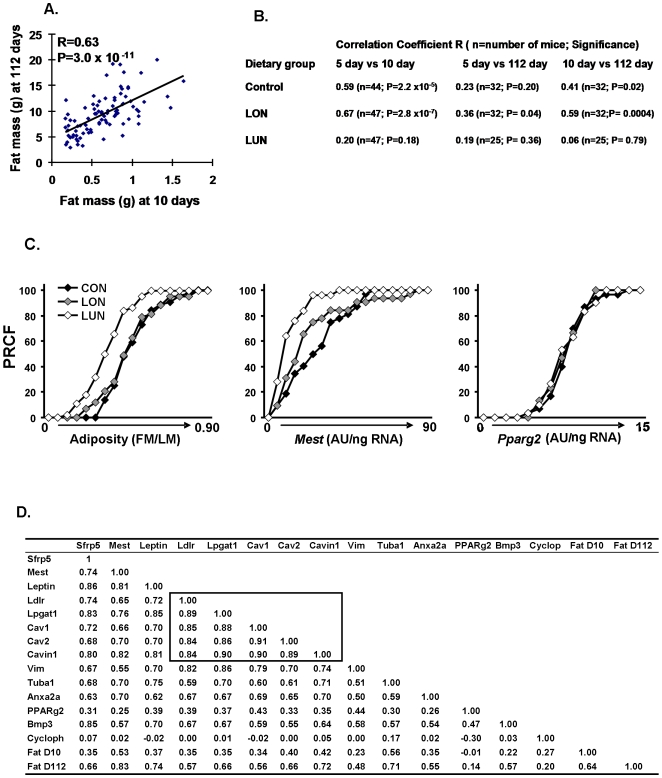
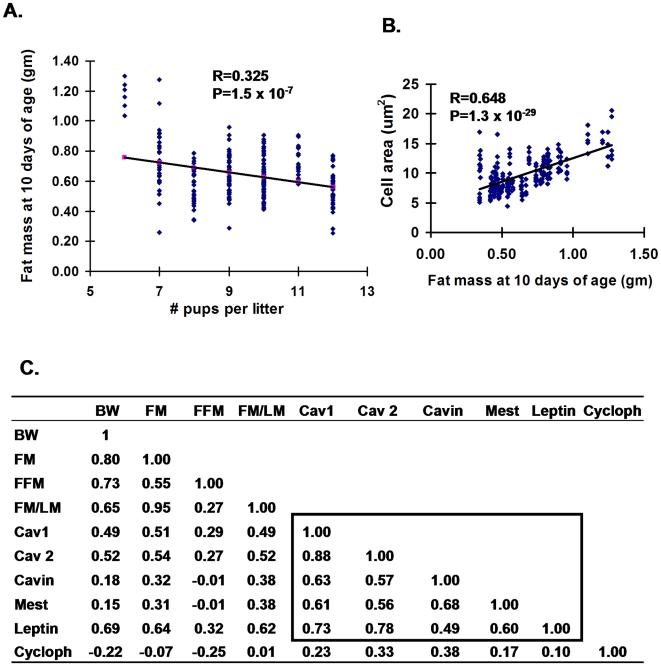
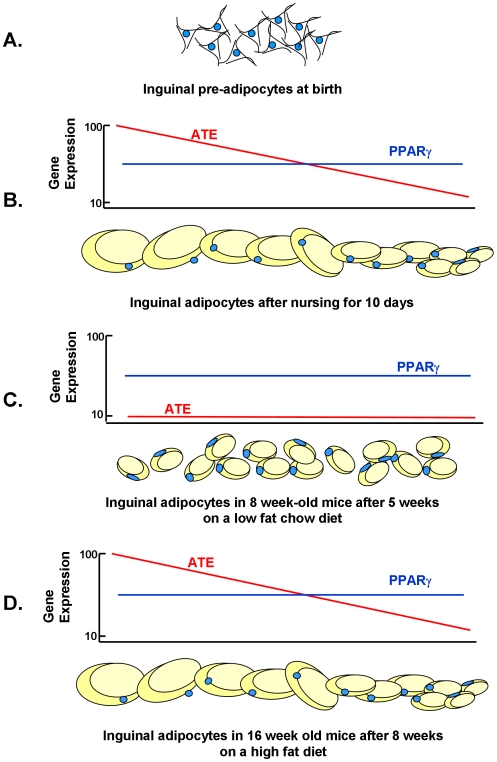
While the phenomenon linking the early nutritional environment to disease susceptibility exists in many mammalian species, the underlying mechanisms are unknown. We hypothesized that nutritional programming is a variable quantitative state of gene expression, fixed by the state of energy balance in the neonate, that waxes and wanes in the adult animal in response to changes in energy balance. We tested this hypothesis with an experiment, based upon global gene expression, to identify networks of genes in which expression patterns in inguinal fat of mice have been altered by the nutritional environment during early post-natal development. The effects of over- and under-nutrition on adiposity and gene expression phenotypes were assessed at 5, 10, 21 days of age and in adult C57Bl/6J mice fed chow followed by high fat diet for 8 weeks. Under-nutrition severely suppressed plasma insulin and leptin during lactation and diet-induced obesity in adult mice, whereas over-nourished mice were phenotypically indistinguishable from those on a control diet. Food intake was not affected by under- or over-nutrition. Microarray gene expression data revealed a major class of genes encoding proteins of the caveolae and cytoskeleton, including Cav1, Cav2, Ptrf (Cavin1), Ldlr, Vldlr and Mest, that were highly associated with adipose tissue expansion in 10 day-old mice during the dynamic phase of inguinal fat development and in adult animals exposed to an obesogenic environment. In conclusion gene expression profiles, fat mass and adipocyte size in 10 day old mice predicted similar phenotypes in adult mice with variable diet-induced obesity. These results are supported by phenotypes of KO mice and suggest that when an animal enters a state of positive energy balance adipose tissue expansion is initiated by coordinate changes in mRNA levels for proteins required for modulating the structure of the caveolae to maximize the capacity of the adipocyte for lipid storage.


Conflict of interest statement

Competing Interests: In September 2009, Leslie P. Kozak received stock options for advising Energesis Inc. in their research to develop drugs that stimulate the induction of brown adipocytes in humans tissue. This consulting is in an area of research totally different from that described in this manuscript and neither Energesis Inc. nor any other commercial entity contributed to the support of this research.

Figures

Figure 1
Figure 1. Phenotypes of adiposity in B6 mice during variation in the early nutritional environment.
A. Morphology of inguinal fat between 2 and 21 days of age as revealed by hematoxylin-eosin staining of paraffin-embedded tissues; magnification was 20×. B. Effects of under-nutrition (LUN) and over-nutrition (LON) from birth to weaning at 21 days of age on body weight and adiposity index (FM/LM). Statistical analysis to determine significant differences between Control vs LON and Control vs LUN was done with a 2-tailed t-test. Except where indicated groups were different at P<0.001; the numbers of animals ranged from 36 to 80. Detailed data on a subgroup of these mice is provided in Supplemental Table S1. C. Effects of LUN and LON on plasma insulin and leptin were determined by Elisa assays. Leptin mRNA levels in the inguinal fat depot from mice 2 to 21 days of age were determined by qRT-PCR. The number of mice in each group equaled 12. Using leptin mRNA and protein data for individual mice from the three nutritional groups between 2 and 21 days of age, the correlation coefficient (R) between plasma leptin and leptin mRNA in the inguinal fat depot was 0.894. D. A schematic diagram of the nutritional protocol from birth to 112 days of age. E. A matrix describing the groups analyzed for gene expression by microarray analysis. RNA was isolated and purified from the inguinal fat depot from individual mice and equal aliquots from each mouse used to construct a pool. Three microarrays from each pool was analyzed.
Figure 2
Figure 2. Heat maps of selective K-means clusters.
Microarrays were performed as described in Materials and Methods. The nutritional conditions and age on the mice for each microarray is shown at the bottom of the figure; C represents control mice, U, under-nutrition during lactation and O, over-nutrition during lactation. Selected genes, based simply on a potential interest on the interaction of the nutritional environment and gene expression for each of 4 clusters are listed on the right-hand side of each heat map.
Figure 3
Figure 3. K-means cluster and Venn analysis strategies for analyzing microarray data to identify genes associated with adipose tissue expansion.
A. The rate of percent fat accumulation per day and the levels of Mest and Bmp3 mRNA, which have previously been shown to always correlate with increased adipose tissue expansion , , provide a pattern of gene expression as a function of developmental age and the nutritional environment that is highly correlated with adipose tissue expansion. B. The heat map of K-means clusters for genes resembling Mest and Bmp3 and a list of candidate genes for functions related to adipose tissue expansion. C. Venn analysis to identify ATE genes up-regulated in mice as neonates during malnutrition or in adults in an obesogenic environment. The Venn analysis was designed to filter out changes in gene expression related to the effects of a high fat diet independent of adipose tissue expansion i.e. Groups C, D. E., the nutritional history or the effects of early development Groups A and B.
Figure 4
Figure 4. Developmental expression profiles of candidate genes of adipose tissue expansion.
A. Top candidate ATE genes with their expression levels and ratios of induction are given on the right. B. The expression profile of ATE genes during development in mice raised under Control, LUN and LON conditions. Data for the levels of expression were taken directly from normalized gene expression data. Supplemental Figure S2 shows comparisons of data for several genes from microarrays with that obtained with qRT-PCR using TaqMan probes to validate the use of data from microarrays for quantitative estimates of gene expression.
Figure 5
Figure 5. Genes encoding cytoskeletal proteins have reduced protein levels.
A. Western blot analysis of α-tubulin and annexin A2 demonstrates that variation in gene expression corresponds to variation in the levels of protein. B. Relative levels of protein illustrate the dependence of protein levels on age and nutritional conditions.
Figure 6
Figure 6. Regression analyses establishes significant associations of fat mass and ATE gene expression at 112 days of age and adiposity at 10 days of age.
A. fat mass at 10 days of age vs fat mass at 112 days of age; B. Regression analyses of fat mass at 5, 10 and 11 days of age under 3 nutritional conditions show that significant associations between adiposity at 5, 10 and 112 days of age depend upon nutritional conditions that promote a positive energy balance during post-natal development. C. Percent relative cumulative frequency (PRCF) p the strong effects of the LUN environment on adiposity and Mest expression, but the lack of effects on PPARγ expression in 112 day-old mice fed a high fat diet for 8 weeks. Data are derived from adiposity and gene expression measurements from at least 25 mice per group. D. A matrix illustrating the correlation coefficients of the major ATE genes and fat mass as well as cyclophilin and PPARγ as control genes at 10 and 112 days of age; Correlations coefficients outlined by the box are unusually strong; N = 83; at R = 0.3, P = 0.01.
Figure 7
Figure 7. Regression analyses of adiposity and gene expression at 10 days of age.
A. Regression analysis of litter size vs fat mass at 10 days of age (130 female and 119 male mice) indicates a weak association; B. the association between fat mass at 10 days of age vs cell area is very high; Average cell areas in 237 randomly chosen fields from the inguinal fat depots of 48 male mice with varying degrees of adiposity are presented. C. Correlation coefficients indicate strong associations between adiposity at 10 days of age and inguinal fat gene expression at 10 days of age among the ATE genes identified by microarray analysis. The 119 male mice of Cohort III were used for these analyses.
Figure 8
Figure 8. Model for the relationship between adipocyte size as determined by the nutritional environment and the expression of genes of adipose tissue expansion (ATE).
A. At birth the absence of mature adipocytes precludes assessment of genes linked to adiposity. B. After 10 days of post-natal development mice raised in a control or LON environment develop adipocytes with a range of sizes that is correlated with the level of ATE genes; Expression of PPARγ has no significant relationship with adipocyte size. C. Following a low fat chow diet for 5 weeks from weaning, the size of adipocytes is reduced and the expression of ATE genes is strongly suppressed, while PPARγ expression is maintained at a stable level. D. The adipocytes expand in size when mice are fed a high-fat diet for 8 weeks and the association between adipose size and ATE gene expression is re-established.

References

    1. Bouchard C, Tremblay A, Despres JP, Nadeau A, Lupien PJ, et al. The response to long-term overfeeding in identical twins. N Engl J Med. 1990;322:1477–1482. - PubMed
    1. Allison DB, Kaprio J, Korkeila M, Koskenvuo M, Neale MC, et al. The heritability of body mass index among an international sample of monozygotic twins reared apart. Int J Obes Relat Metab Disord. 1996;20:501–506. - PubMed
    1. Barsh GS, Farooqi IS, O'Rahilly S. Genetics of body-weight regulation. Nature. 2000;404:644–651. - PubMed
    1. Hill JO, Wyatt HR, Reed GW, Peters JC. Obesity and the environment: where do we go from here? Science. 2003;299:853–855. - PubMed
    1. Levine JA, Eberhardt NL, Jensen MD. Role of nonexercise activity thermogenesis in resistance to fat gain in humans [see comments]. Science. 1999;283:212–214. - PubMed

Publication types

MeSH terms

Associated data