

Genomic subtypes of breast cancer identified by array-comparative genomic hybridization display distinct molecular and clinical characteristics
- PMID: 20576095
- PMCID: PMC2917037
- DOI: 10.1186/bcr2596
Genomic subtypes of breast cancer identified by array-comparative genomic hybridization display distinct molecular and clinical characteristics
Abstract
Introduction: Breast cancer is a profoundly heterogeneous disease with respect to biologic and clinical behavior. Gene-expression profiling has been used to dissect this complexity and to stratify tumors into intrinsic gene-expression subtypes, associated with distinct biology, patient outcome, and genomic alterations. Additionally, breast tumors occurring in individuals with germline BRCA1 or BRCA2 mutations typically fall into distinct subtypes.
Methods: We applied global DNA copy number and gene-expression profiling in 359 breast tumors. All tumors were classified according to intrinsic gene-expression subtypes and included cases from genetically predisposed women. The Genomic Identification of Significant Targets in Cancer (GISTIC) algorithm was used to identify significant DNA copy-number aberrations and genomic subgroups of breast cancer.
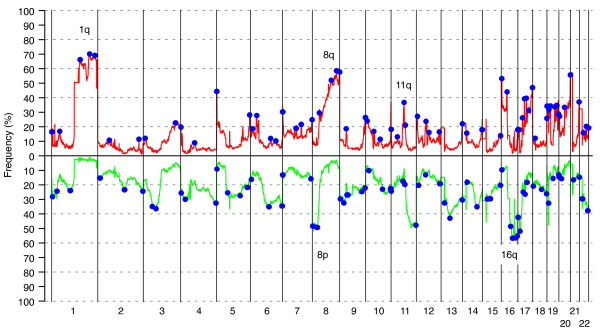
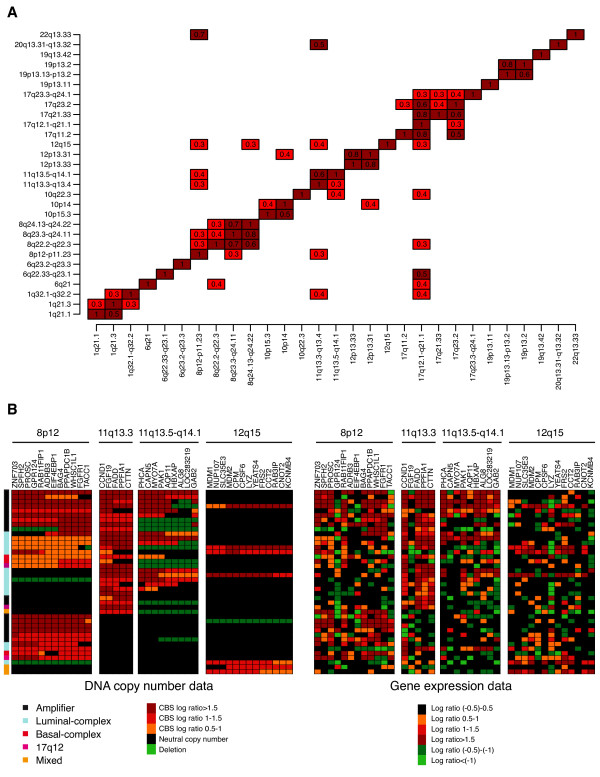
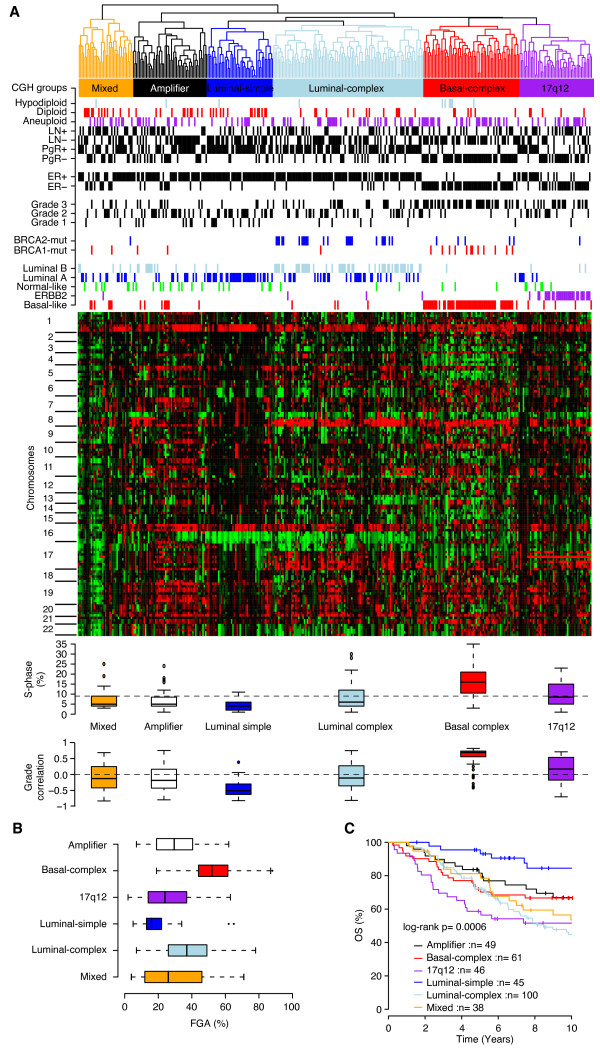
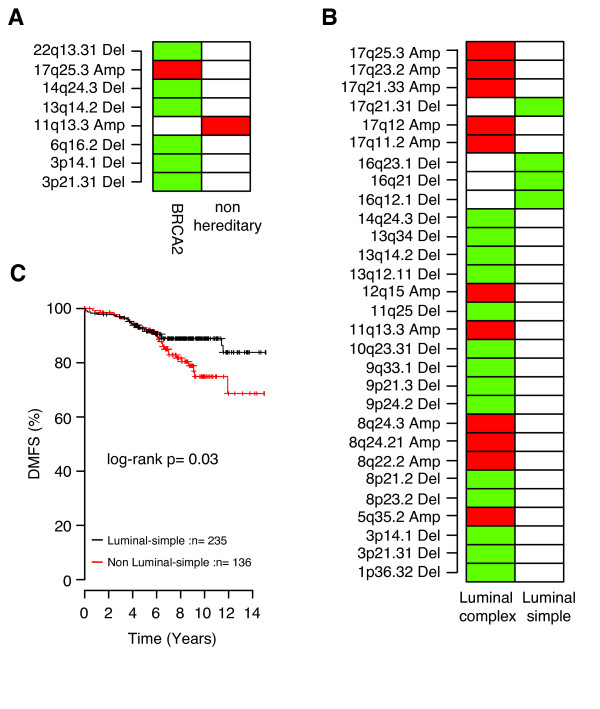
Results: We identified 31 genomic regions that were highly amplified in > 1% of the 359 breast tumors. Several amplicons were found to co-occur, the 8p12 and 11q13.3 regions being the most frequent combination besides amplicons on the same chromosomal arm. Unsupervised hierarchical clustering with 133 significant GISTIC regions revealed six genomic subtypes, termed 17q12, basal-complex, luminal-simple, luminal-complex, amplifier, and mixed subtypes. Four of them had striking similarity to intrinsic gene-expression subtypes and showed associations to conventional tumor biomarkers and clinical outcome. However, luminal A-classified tumors were distributed in two main genomic subtypes, luminal-simple and luminal-complex, the former group having a better prognosis, whereas the latter group included also luminal B and the majority of BRCA2-mutated tumors. The basal-complex subtype displayed extensive genomic homogeneity and harbored the majority of BRCA1-mutated tumors. The 17q12 subtype comprised mostly HER2-amplified and HER2-enriched subtype tumors and had the worst prognosis. The amplifier and mixed subtypes contained tumors from all gene-expression subtypes, the former being enriched for 8p12-amplified cases, whereas the mixed subtype included many tumors with predominantly DNA copy-number losses and poor prognosis.
Conclusions: Global DNA copy-number analysis integrated with gene-expression data can be used to dissect the complexity of breast cancer. This revealed six genomic subtypes with different clinical behavior and a striking concordance to the intrinsic subtypes. These genomic subtypes may prove useful for understanding the mechanisms of tumor development and for prognostic and treatment prediction purposes.
Figures
Similar articles
-
Molecular subtypes of breast cancer are associated with characteristic DNA methylation patterns.Breast Cancer Res. 2010;12(3):R36. doi: 10.1186/bcr2590. Epub 2010 Jun 18. Breast Cancer Res. 2010. PMID: 20565864 Free PMC article.
-
High-resolution genomic and expression analyses of copy number alterations in HER2-amplified breast cancer.Breast Cancer Res. 2010;12(3):R25. doi: 10.1186/bcr2568. Epub 2010 May 6. Breast Cancer Res. 2010. PMID: 20459607 Free PMC article.
-
Cross-species comparison of aCGH data from mouse and human BRCA1- and BRCA2-mutated breast cancers.BMC Cancer. 2010 Aug 24;10:455. doi: 10.1186/1471-2407-10-455. BMC Cancer. 2010. PMID: 20735817 Free PMC article.
-
Nonfamilial breast cancer subtypes.Methods Mol Biol. 2013;973:279-95. doi: 10.1007/978-1-62703-281-0_18. Methods Mol Biol. 2013. PMID: 23412797 Review.
-
Deconstructing the molecular portrait of basal-like breast cancer.Trends Mol Med. 2006 Nov;12(11):537-44. doi: 10.1016/j.molmed.2006.09.004. Epub 2006 Sep 29. Trends Mol Med. 2006. PMID: 17011236 Review.
Cited by
-
Bayesian Neural Networks for Selection of Drug Sensitive Genes.J Am Stat Assoc. 2018;113(523):955-972. doi: 10.1080/01621459.2017.1409122. Epub 2018 Jun 28. J Am Stat Assoc. 2018. PMID: 31354179 Free PMC article.
-
Assessment of palindromes as platforms for DNA amplification in breast cancer.Genome Res. 2012 Feb;22(2):232-45. doi: 10.1101/gr.117226.110. Epub 2011 Jul 13. Genome Res. 2012. PMID: 21752925 Free PMC article.
-
NETWORK DIFFERENTIAL CONNECTIVITY ANALYSIS.Ann Appl Stat. 2022 Dec;16(4):2166-2182. doi: 10.1214/21-aoas1581. Epub 2022 Sep 26. Ann Appl Stat. 2022. PMID: 37842097 Free PMC article.
-
A refined molecular taxonomy of breast cancer.Oncogene. 2012 Mar 1;31(9):1196-206. doi: 10.1038/onc.2011.301. Epub 2011 Jul 25. Oncogene. 2012. PMID: 21785460 Free PMC article.
-
Genomic profiling of CHEK2*1100delC-mutated breast carcinomas.BMC Cancer. 2015 Nov 9;15:877. doi: 10.1186/s12885-015-1880-y. BMC Cancer. 2015. PMID: 26553136 Free PMC article.
References
-
- Perou CM, Sorlie T, Eisen MB, van de Rijn M, Jeffrey SS, Rees CA, Pollack JR, Ross DT, Johnsen H, Akslen LA, Fluge O, Pergamenschikov A, Williams C, Zhu SX, Lonning PE, Borresen-Dale AL, Brown PO, Botstein D. Molecular portraits of human breast tumours. Nature. 2000;406:747–752. doi: 10.1038/35021093. - DOI - PubMed
-
- Sorlie T, Tibshirani R, Parker J, Hastie T, Marron JS, Nobel A, Deng S, Johnsen H, Pesich R, Geisler S, Demeter J, Perou CM, Lonning PE, Brown PO, Borresen-Dale AL, Botstein D. Repeated observation of breast tumor subtypes in independent gene expression data sets. Proc Natl Acad Sci USA. 2003;100:8418–8423. doi: 10.1073/pnas.0932692100. - DOI - PMC - PubMed
-
- Chin K, DeVries S, Fridlyand J, Spellman PT, Roydasgupta R, Kuo WL, Lapuk A, Neve RM, Qian Z, Ryder T, Chen F, Feiler H, Tokuyasu T, Kingsley C, Dairkee S, Meng Z, Chew K, Pinkel D, Jain A, Ljung BM, Esserman L, Albertson DG, Waldman FM, Gray JW. Genomic and transcriptional aberrations linked to breast cancer pathophysiologies. Cancer Cell. 2006;10:529–541. doi: 10.1016/j.ccr.2006.10.009. - DOI - PubMed
-
- Hu Z, Fan C, Oh DS, Marron JS, He X, Qaqish BF, Livasy C, Carey LA, Reynolds E, Dressler L, Nobel A, Parker J, Ewend MG, Sawyer LR, Wu J, Liu Y, Nanda R, Tretiakova M, Ruiz Orrico A, Dreher D, Palazzo JP, Perreard L, Nelson E, Mone M, Hansen H, Mullins M, Quackenbush JF, Ellis MJ, Olopade OI, Bernard PS. The molecular portraits of breast tumors are conserved across microarray platforms. BMC Genomics. 2006;7:96. doi: 10.1186/1471-2164-7-96. - DOI - PMC - PubMed
-
- Gene Expression Omnibus. http://www.ncbi.nlm.nih.gov/geo/
Publication types
MeSH terms
Substances
LinkOut - more resources
Full Text Sources
Other Literature Sources
Medical
Molecular Biology Databases
Research Materials
Miscellaneous
