

Pulse pressure variation and volume responsiveness during acutely increased pulmonary artery pressure: an experimental study
- PMID: 20576099
- PMCID: PMC2911770
- DOI: 10.1186/cc9080
Pulse pressure variation and volume responsiveness during acutely increased pulmonary artery pressure: an experimental study
Abstract
Introduction: We found that pulse pressure variation (PPV) did not predict volume responsiveness in patients with increased pulmonary artery pressure. This study tests the hypothesis that PPV does not predict fluid responsiveness during an endotoxin-induced acute increase in pulmonary artery pressure and right ventricular loading.
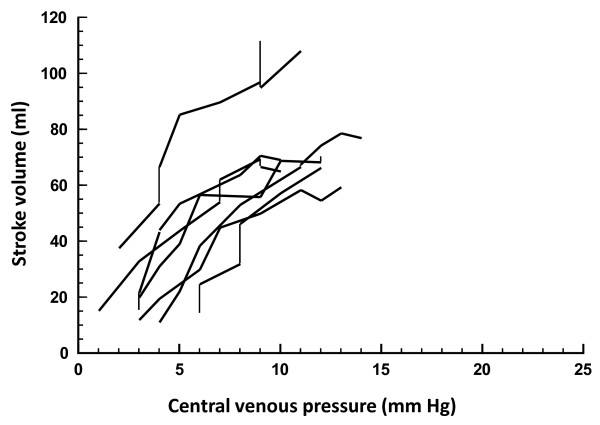
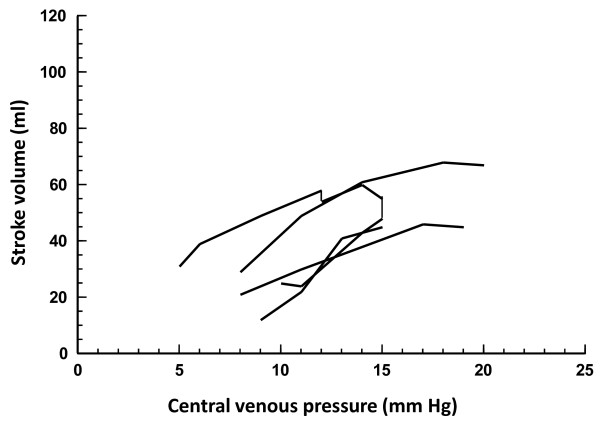
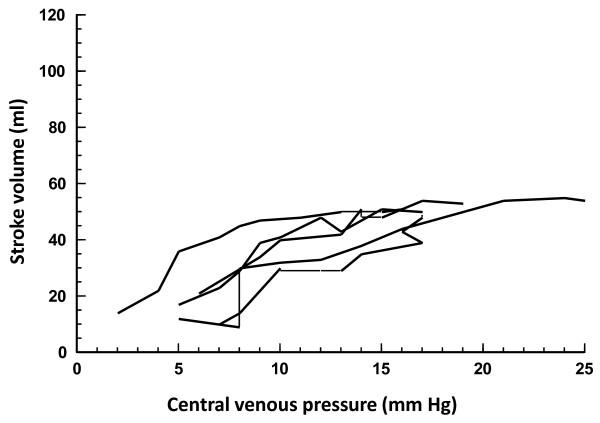
Methods: Pigs were subjected to endotoxemia (0.4 microg/kg/hour lipopolysaccharide), followed by volume expansion, subsequent hemorrhage (20% of estimated blood volume), retransfusion, and additional stepwise volume loading until cardiac output did not increase further (n = 5). A separate control group (n = 7) was subjected to bleeding, retransfusion, and volume expansion without endotoxemia. Systemic hemodynamics were measured at baseline and after each intervention, and PPV was calculated offline. Prediction of fluid-challenge-induced stroke volume increase by PPV was analyzed using receiver operating characteristic (ROC) curves.
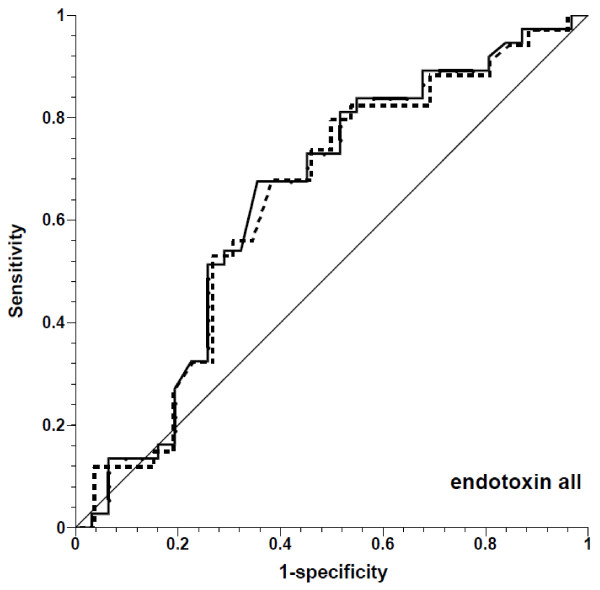
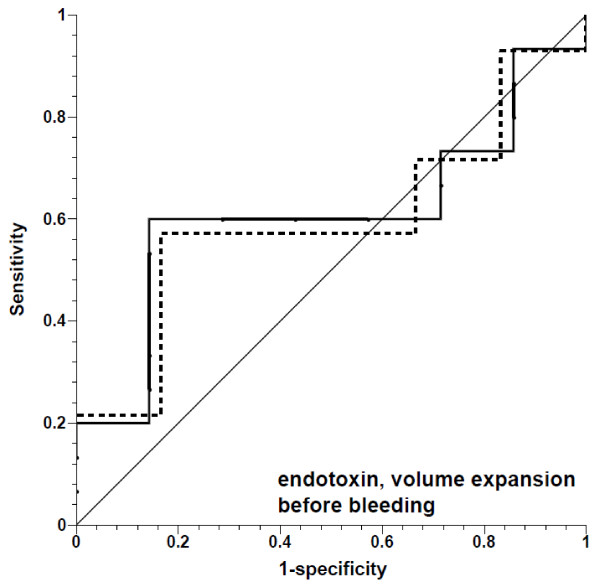
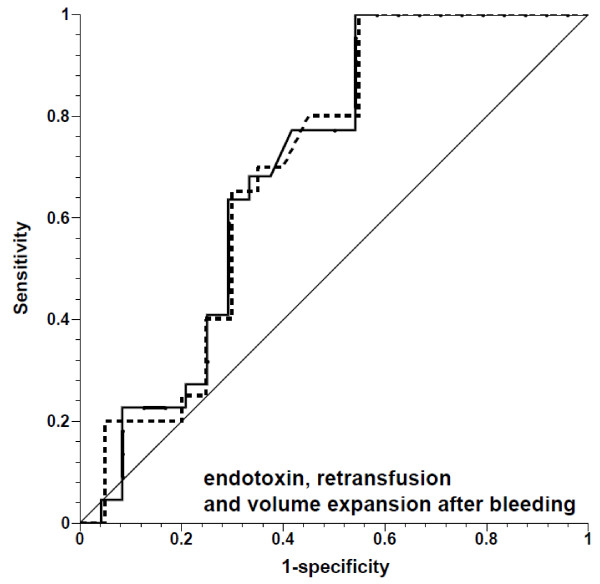
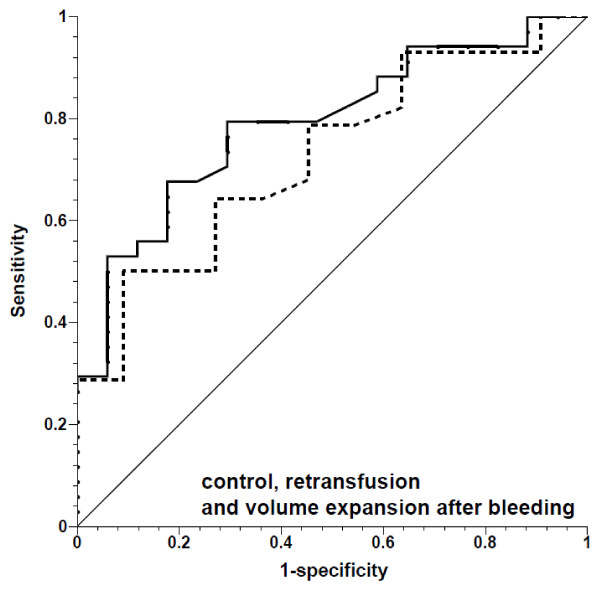
Results: Sixty-eight volume challenges were performed in endotoxemic animals (22 before and 46 after hemorrhage), and 51 volume challenges in the controls. Endotoxin infusion resulted in an acute increase in pulmonary artery and central venous pressure and a decrease in stroke volume (all P < 0.05). In endotoxemia, 68% of volume challenges before hemorrhage increased the stroke volume by > 10%, but PPV did not predict fluid responsiveness (area under the ROC curve = 0.604, P = 0.461). After hemorrhage in endotoxemia, stroke volume increased in 48% and the predictive value of PPV improved (area under the ROC curve for PPV = 0.699, P = 0.021). In controls after hemorrhage, stroke volume increased in 67% of volume challenges and PPV was a predictor of fluid responsiveness (area under the ROC curve = 0.790, P = 0.001).
Conclusions: Fluid responsiveness cannot be predicted with PPV during acute pulmonary hypertension in porcine endotoxemia. Even following severe hemorrhage during endotoxemia, the predictive value of PPV is marginal.
Figures
Comment in
-
Using pulse pressure variation or stroke volume variation to diagnose right ventricular failure?Crit Care. 2010;14(6):451; author reply 451. doi: 10.1186/cc9303. Epub 2010 Nov 24. Crit Care. 2010. PMID: 21172070 Free PMC article. No abstract available.
Similar articles
-
Further cautions for the use of ventilatory-induced changes in arterial pressures to predict volume responsiveness.Crit Care. 2010;14(5):197. doi: 10.1186/cc9223. Epub 2010 Sep 20. Crit Care. 2010. PMID: 20920155 Free PMC article. Review.
-
Pulse-pressure variation and hemodynamic response in patients with elevated pulmonary artery pressure: a clinical study.Crit Care. 2010;14(3):R111. doi: 10.1186/cc9060. Epub 2010 Jun 11. Crit Care. 2010. PMID: 20540730 Free PMC article.
-
Predicting fluid responsiveness during infrarenal aortic cross-clamping in pigs.J Cardiothorac Vasc Anesth. 2013 Dec;27(6):1101-7. doi: 10.1053/j.jvca.2013.03.030. Epub 2013 Sep 21. J Cardiothorac Vasc Anesth. 2013. PMID: 24060469
-
Influence of increased intra-abdominal pressure on fluid responsiveness predicted by pulse pressure variation and stroke volume variation in a porcine model.Crit Care Med. 2009 Feb;37(2):650-8. doi: 10.1097/CCM.0b013e3181959864. Crit Care Med. 2009. PMID: 19114894
-
Existing fluid responsiveness studies using the mini-fluid challenge may be misleading: Methodological considerations and simulations.Acta Anaesthesiol Scand. 2022 Jan;66(1):17-24. doi: 10.1111/aas.13965. Epub 2021 Aug 19. Acta Anaesthesiol Scand. 2022. PMID: 34338314 Review.
Cited by
-
Cardiopulmonary interactions-which monitoring tools to use?Front Physiol. 2023 Aug 9;14:1234915. doi: 10.3389/fphys.2023.1234915. eCollection 2023. Front Physiol. 2023. PMID: 37621761 Free PMC article. Review.
-
On the right side of the heart: Medical and mechanical support of the failing right ventricle.J Intensive Care Soc. 2017 May;18(2):113-120. doi: 10.1177/1751143716684357. Epub 2017 Jan 3. J Intensive Care Soc. 2017. PMID: 28979557 Free PMC article. Review.
-
Further cautions for the use of ventilatory-induced changes in arterial pressures to predict volume responsiveness.Crit Care. 2010;14(5):197. doi: 10.1186/cc9223. Epub 2010 Sep 20. Crit Care. 2010. PMID: 20920155 Free PMC article. Review.
-
Pulmonary hypertension attenuates the dynamic preload indicators increase during experimental hypovolemia.BMC Anesthesiol. 2017 Mar 3;17(1):35. doi: 10.1186/s12871-017-0329-z. BMC Anesthesiol. 2017. PMID: 28253850 Free PMC article.
-
Expanding the usefulness of hemodynamic waveform analysis in the critically Ill.J Clin Monit Comput. 2019 Aug;33(4):563-564. doi: 10.1007/s10877-018-00239-y. Epub 2019 Jan 2. J Clin Monit Comput. 2019. PMID: 30603822 Free PMC article. No abstract available.
References
-
- Coyle JP, Teplick RS, Long MC. Respiratory variations in systemic arterial pressure as an indicator of volume status. Anesthesiology. 1983;59:A53.
-
- Michard F, Boussat S, Chemla D, Anguel N, Mercat A, Lecarpentier Y, Richard C, Pinsky MR, Teboul JL. Relation between respiratory changes in arterial pulse pressure and fluid responsiveness in septic patients with acute circulatory failure. Am J Respir Crit Care Med. 2000;162:134–138. - PubMed
-
- Reuter DA, Felbinger TW, Schmidt C, Kilger E, Goedje O, Lamm P, Goetz AE. Stroke volume variations for assessment of cardiac responsiveness to volume loading in mechanically ventilated patients after cardiac surgery. Intensive Care Med. 2002;28:392–398. doi: 10.1007/s00134-002-1211-z. - DOI - PubMed
