

Calculation of partial isotope incorporation into peptides measured by mass spectrometry
- PMID: 20576105
- PMCID: PMC2913921
- DOI: 10.1186/1756-0500-3-178
Calculation of partial isotope incorporation into peptides measured by mass spectrometry
Abstract
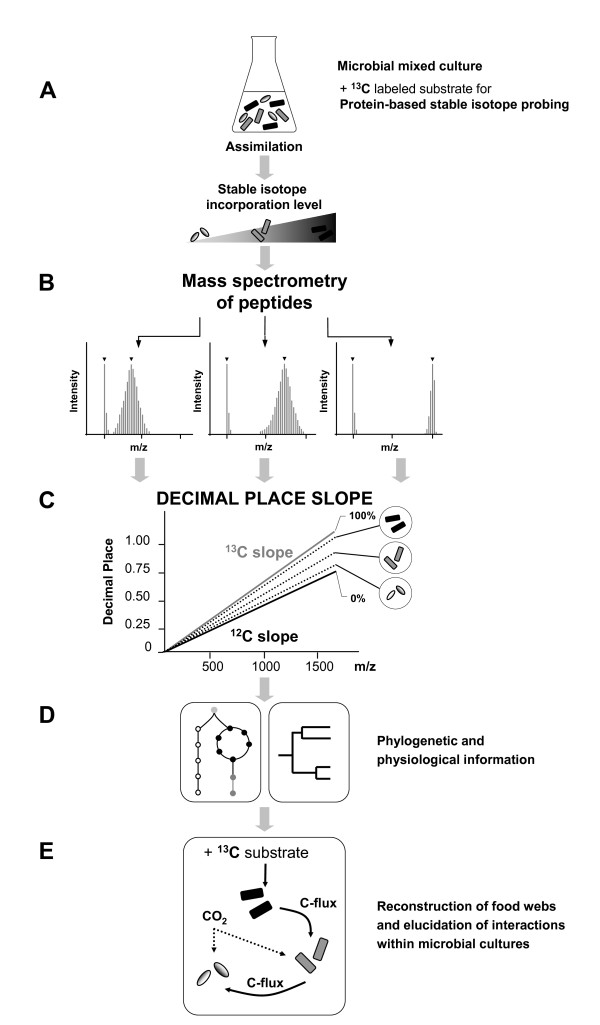
Background: Stable isotope probing (SIP) technique was developed to link function, structure and activity of microbial cultures metabolizing carbon and nitrogen containing substrates to synthesize their biomass. Currently, available methods are restricted solely to the estimation of fully saturated heavy stable isotope incorporation and convenient methods with sufficient accuracy are still missing. However in order to track carbon fluxes in microbial communities new methods are required that allow the calculation of partial incorporation into biomolecules.
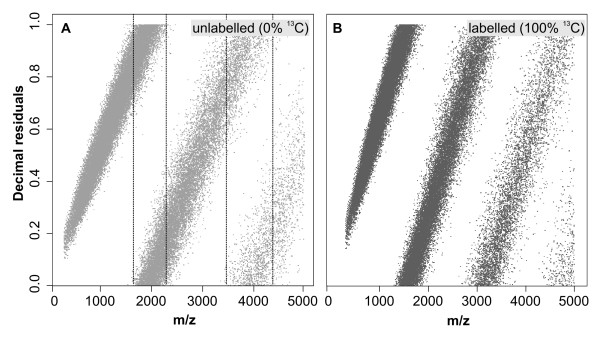
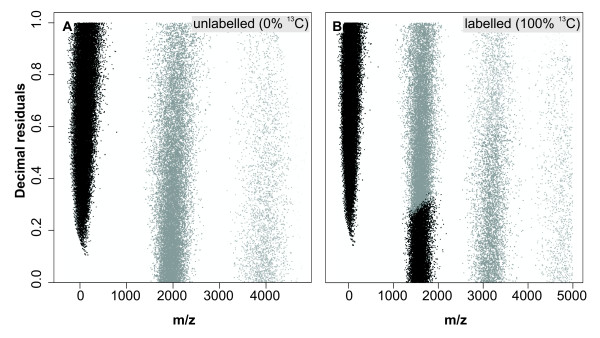
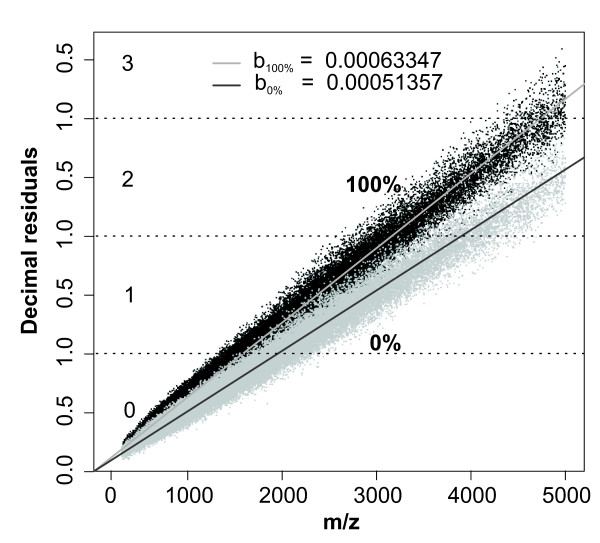
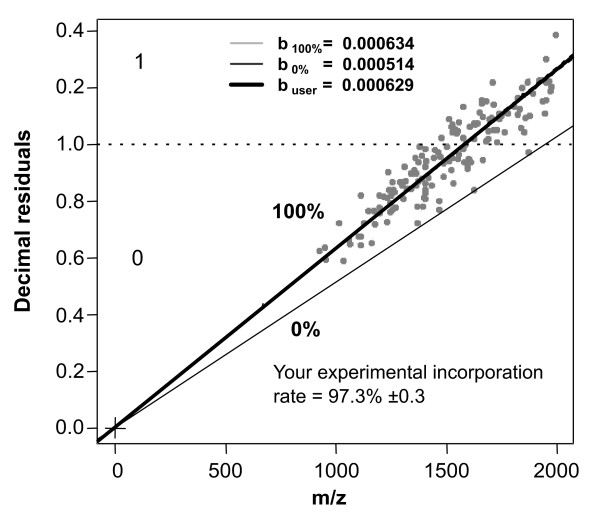
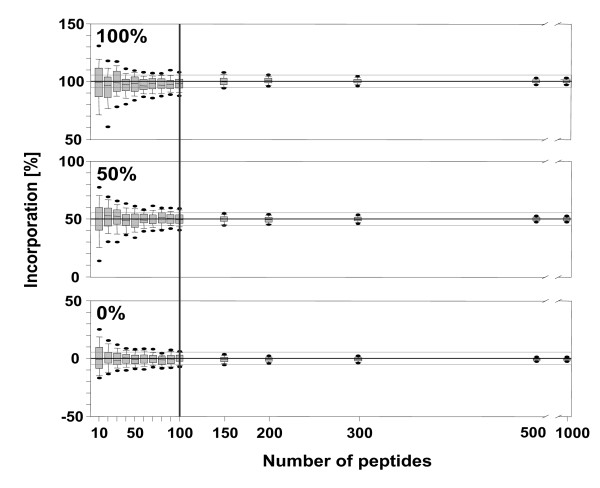
Results: In this study, we use the characteristics of the so-called 'half decimal place rule' (HDPR) in order to accurately calculate the partial13C incorporation in peptides from enzymatic digested proteins. Due to the clade-crossing universality of proteins within bacteria, any available high-resolution mass spectrometry generated dataset consisting of tryptically-digested peptides can be used as reference.We used a freely available peptide mass dataset from Mycobacterium tuberculosis consisting of 315,579 entries. From this the error of estimated versus known heavy stable isotope incorporation from an increasing number of randomly drawn peptide sub-samples (100 times each; no repetition) was calculated. To acquire an estimated incorporation error of less than 5 atom %, about 100 peptide masses were needed. Finally, for testing the general applicability of our method, peptide masses of tryptically digested proteins from Pseudomonas putida ML2 grown on labeled substrate of various known concentrations were used and13C isotopic incorporation was successfully predicted. An easy-to-use script 1 was further developed to guide users through the calculation procedure for their own data series.
Conclusion: Our method is valuable for estimating13C incorporation into peptides/proteins accurately and with high sensitivity. Generally, our method holds promise for wider applications in qualitative and especially quantitative proteomics.
Figures
Similar articles
-
Decimal place slope, a fast and precise method for quantifying 13C incorporation levels for detecting the metabolic activity of microbial species.Mol Cell Proteomics. 2010 Jun;9(6):1221-7. doi: 10.1074/mcp.M900407-MCP200. Epub 2010 Jan 11. Mol Cell Proteomics. 2010. PMID: 20064840 Free PMC article.
-
Exploring the limits of robust detection of incorporation of 13C by mass spectrometry in protein-based stable isotope probing (protein-SIP).Anal Bioanal Chem. 2011 Oct;401(6):1975-82. doi: 10.1007/s00216-011-5289-4. Epub 2011 Aug 7. Anal Bioanal Chem. 2011. PMID: 21822970
-
Incorporation of carbon and nitrogen atoms into proteins measured by protein-based stable isotope probing (Protein-SIP).Rapid Commun Mass Spectrom. 2008 Sep;22(18):2889-97. doi: 10.1002/rcm.3684. Rapid Commun Mass Spectrom. 2008. PMID: 18727149
-
Protein-based stable isotope probing (protein-SIP) in functional metaproteomics.Mass Spectrom Rev. 2012 Nov-Dec;31(6):683-97. doi: 10.1002/mas.21346. Epub 2012 Mar 15. Mass Spectrom Rev. 2012. PMID: 22422553 Review.
-
Mass spectrometry-based proteomics turns quantitative.Nat Chem Biol. 2005 Oct;1(5):252-62. doi: 10.1038/nchembio736. Nat Chem Biol. 2005. PMID: 16408053 Review.
Cited by
-
Carrot solution culture bioproduction of uniformly labeled 13C-lutein and in vivo dosing in non-human primates.Exp Biol Med (Maywood). 2017 Feb;242(3):305-315. doi: 10.1177/1535370216675067. Epub 2016 Oct 23. Exp Biol Med (Maywood). 2017. PMID: 27798119 Free PMC article.
-
Quantitative tracking of isotope flows in proteomes of microbial communities.Mol Cell Proteomics. 2011 Apr;10(4):M110.006049. doi: 10.1074/mcp.M110.006049. Epub 2011 Feb 1. Mol Cell Proteomics. 2011. PMID: 21285414 Free PMC article.
-
Insights from quantitative metaproteomics and protein-stable isotope probing into microbial ecology.ISME J. 2013 Oct;7(10):1877-85. doi: 10.1038/ismej.2013.78. Epub 2013 May 16. ISME J. 2013. PMID: 23677009 Free PMC article. Review.
-
Protein-based stable isotope probing.Nat Protoc. 2010 Dec;5(12):1957-66. doi: 10.1038/nprot.2010.166. Epub 2010 Nov 18. Nat Protoc. 2010. PMID: 21127489
References
-
- UFZ Leipzig. http://www.ufz.de/index.php?en=18365
-
- Boschker HTS, Nold SC, Wellsbury P, Bos D, de Graaf W, Pel R, Parkes RJ, Cappenberg TE. Direct linking of microbial populations to specific biogeochemical processes by C-13-labelling of biomarkers. Nature. 1998;392(6678):801–805. doi: 10.1038/33900. - DOI
LinkOut - more resources
Full Text Sources
Other Literature Sources
Miscellaneous
