. 2010 Jun 24:3:24.
doi: 10.1186/1755-8794-3-24.

Examining smoking-induced differential gene expression changes in buccal mucosa

Affiliations

Examining smoking-induced differential gene expression changes in buccal mucosa

Doris M Kupfer et al. BMC Med Genomics. .

Abstract

Background: Gene expression changes resulting from conditions such as disease, environmental stimuli, and drug use, can be monitored in the blood. However, a less invasive method of sample collection is of interest because of the discomfort and specialized personnel necessary for blood sampling especially if multiple samples are being collected. Buccal mucosa cells are easily collected and may be an alternative sample material for biomarker testing. A limited number of studies, primarily in the smoker/oral cancer literature, address this tissue's efficacy as an RNA source for expression analysis. The current study was undertaken to determine if total RNA isolated from buccal mucosa could be used as an alternative tissue source to assay relative gene expression.

Methods: Total RNA was isolated from swabs, reverse transcribed and amplified. The amplified cDNA was used in RT-qPCR and microarray analyses to evaluate gene expression in buccal cells. Initially, RT-qPCR was used to assess relative transcript levels of four genes from whole blood and buccal cells collected from the same seven individuals, concurrently. Second, buccal cell RNA was used for microarray-based differential gene expression studies by comparing gene expression between a group of female smokers and nonsmokers.

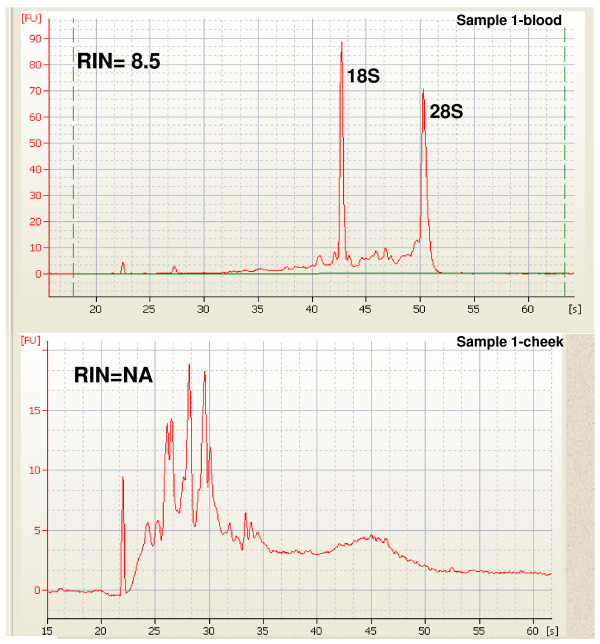
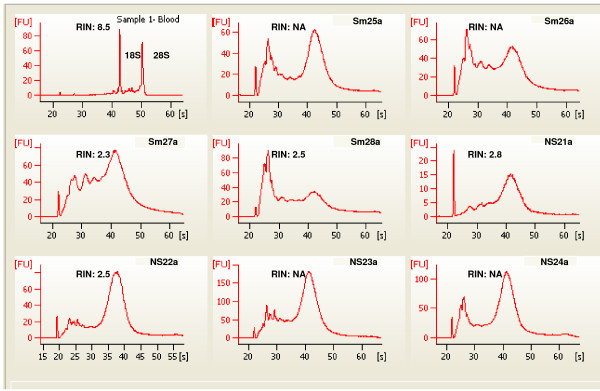
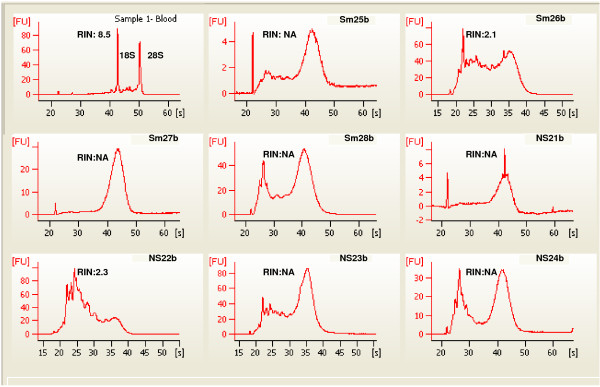
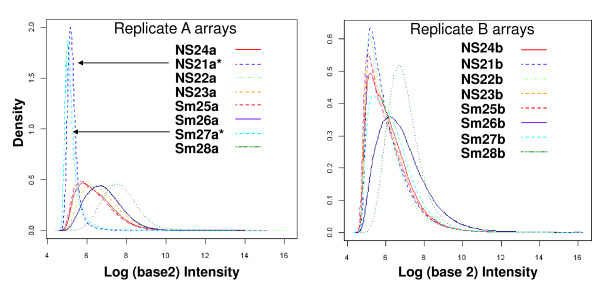
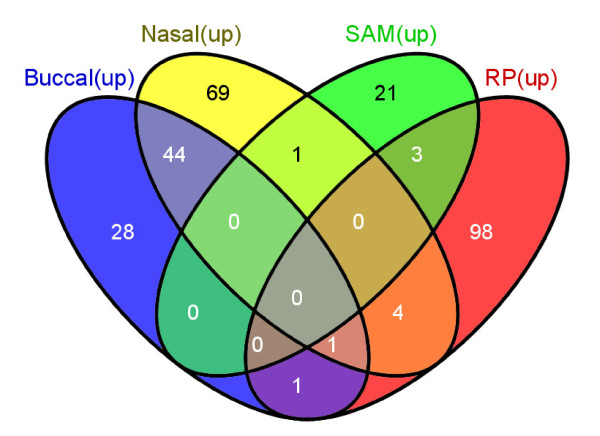
Results: An amplification protocol allowed use of less buccal cell total RNA (50 ng) than had been reported previously with human microarrays. Total RNA isolated from buccal cells was degraded but was of sufficient quality to be used with RT-qPCR to detect expression of specific genes. We report here the finding of a small number of statistically significant differentially expressed genes between smokers and nonsmokers, using buccal cells as starting material. Gene Set Enrichment Analysis confirmed that these genes had a similar expression pattern to results from another study.

Conclusions: Our results suggest that despite a high degree of degradation, RNA from buccal cells from cheek mucosa could be used to detect differential gene expression between smokers and nonsmokers. However the RNA degradation, increase in sample variability and microarray failure rate show that buccal samples should be used with caution as source material in expression studies.


Figures

Figure 1
Figure 1
Representative qPCR matched blood and buccal mucosa samples. The buccal RNA (cheek) appears to be heavily degraded compared to the blood RNA since there is no evidence of 18 or 28S rRNA peaks and the bulk of material is migrating rapidly indicating small size. RIN, RNA integrity number; NA, no RIN determination possible.
Figure 2
Figure 2
Buccal mucosa total RNA from smokers and nonsmokers, the group a buccal cell samples. Note variation between the isolates in peak heights and species. Sm Smokers, NS nonsmoker. Sample 1, whole blood total RNA as seen in Figure 1 for comparison, showing 18S and 28S ribosomal peaks. RIN, RNA integrity number; NA no RIN determination possible.
Figure 3
Figure 3
Buccal mucosa total RNA from smokers and nonsmokers, the group b buccal samples. Sample 1, total RNA from whole blood is added for comparison. Compare to Figure 2. For example Sm26a and Sm26b are from opposite cheeks of same subject and show some similarity in migration pattern. The same variation in peak heights and species between samples is seen here as in Figure 2. RIN, RNA integrity Number; NA, no RIN determination possible.
Figure 4
Figure 4
Replicate Samples a and b Raw Signal Value Histograms. Two arrays, NS21a and Sm27a have low overall signal strength as shown by the intensity plot. The arrays from the matching b cheek NS21b and Sm27b show acceptable values. Note the difference in y-axis density scale. NS nonsmoker, Sm smoker.
Figure 5
Figure 5
Venn diagram showing overlap among the four gene lists upregulated in smokers.
Figure 6
Figure 6
A graphic showing the PAINT TRE for the SAM_upSm gene list. Color has been added to indicate membership in a particular IPA functional network. Thirteen of the 25 SAM_upSm target genes are contained in both IPA and PAINT analyses. The ovals represent target genes identified by PAINT as having transcription factor binding sites upstream of the gene. The color of the oval corresponds to the functional networks in which IPA placed the gene. The two gray ovals represent genes not included in the IPA network. The rectangles indicate transcription factors. Arrows connect the transcription factors to genes with corresponding upstream binding sites.
Figure 7
Figure 7
A graphic showing the PAINT TRE for the RP_upSm gene list. Thirty-eight of 103 RP_upSm target genes are contained in both IPA and PAINT analyses. The ovals represent target genes identified by PAINT as having transcription factor binding sites upstream of the gene. The color of the oval corresponds to the functional networks in which IPA placed the gene. The four gray ovals represent genes not included in the IPA network. The rectangles indicate transcription factors. Arrows connect the transcription factors to genes with corresponding upstream binding sites. Compare to figure 6.

References

    1. Thompson MD, Bowen RA, Wong YBY, Antal J, Liu Z, Yu H, Siminovitch K, Kreiger N, Rohan TE, Cole DE. Whole genome amplification of buccal cell DNA: genotyping concordance before and after multiple displacement amplification. Clin Chem Lab Med. 2005;43(2):157–162. doi: 10.1515/CCLM.2005.026. - DOI - PubMed
    1. Ceder O, van Dijken J, Ericson T, Kollberg H. Ribonuclease in different types of saliva from cystic fibrosis patients. Acta Paediatr Scand. 1985;74:102–106. doi: 10.1111/j.1651-2227.1985.tb10928.x. - DOI - PubMed
    1. Vondracek M, Xi Z, Larsson P, Baker V, Mace K, Pfeifer A, Tjalve H, Donato MT, Gomez-Lechon MJ, Grafstrom RC. Cytochrome P450 expression and related metabolism in human buccal mucosa. Carcinogenesis. 2001;22(3):481–488. doi: 10.1093/carcin/22.3.481. - DOI - PubMed
    1. Spira A, Beane J, Schembri F, Liu G, Ding C, Gilman S, Yang X, Cantor C, Brody JS. Noninvasive method for obtaining RNA from buccal mucosa epithelial cells for gene expression profiling. BioTechniques. 2004;36:484–487. - PubMed
    1. Spivack SD, Hurteau GJ, Jain R, Kumar SV, Aldous MKM, Gierthy JF, Kaminsky LS. Gene-environment interaction signatures by quantitative mRNA profiling in exfoliated buccal mucosal cells. Cancer Res. 2004;64:6805–6813. doi: 10.1158/0008-5472.CAN-04-1771. - DOI - PubMed