Review
. 2010 Sep;7(3):299-341.
doi: 10.1016/j.plrev.2010.06.001. Epub 2010 Jun 4.

Biophysical characterization of DNA binding from single molecule force measurements

Affiliations
Review

Biophysical characterization of DNA binding from single molecule force measurements

Kathy R Chaurasiya et al. Phys Life Rev. 2010 Sep.

Abstract

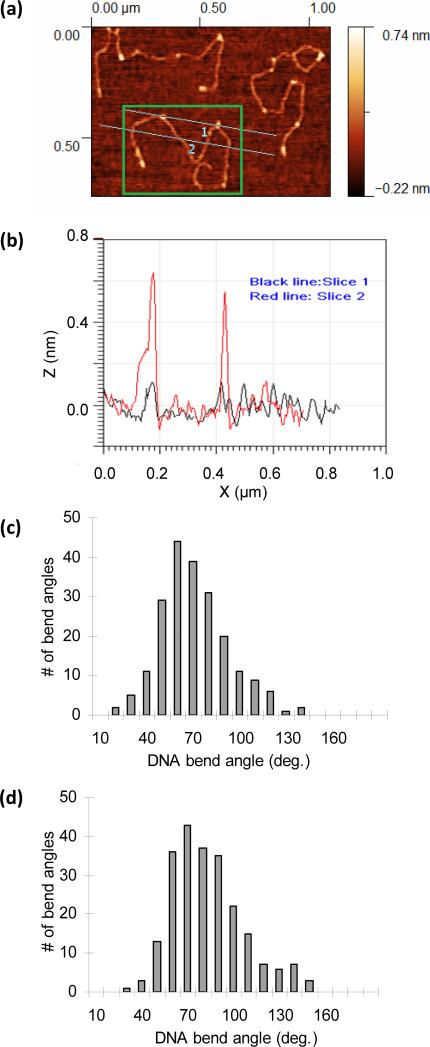
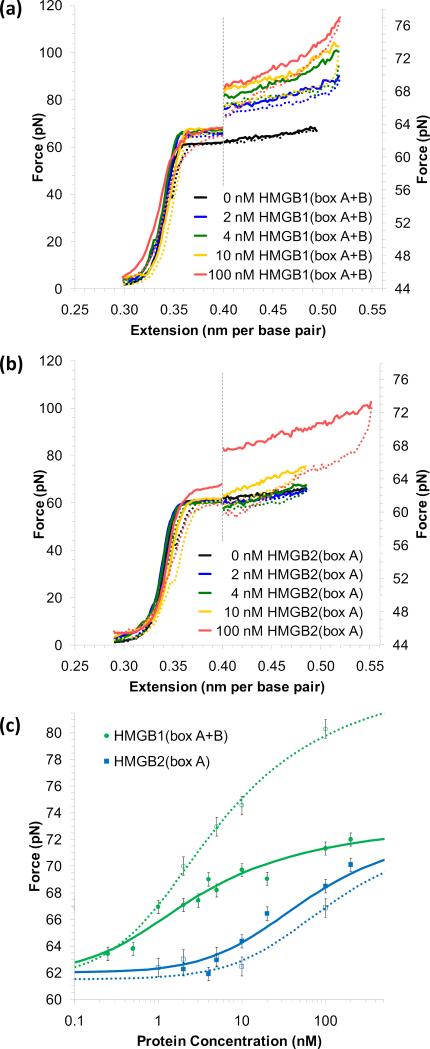
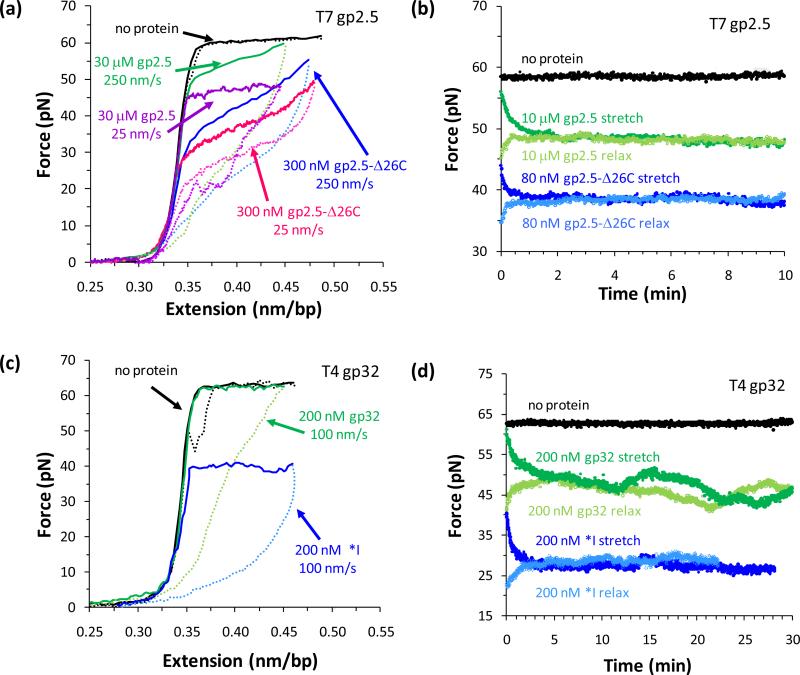
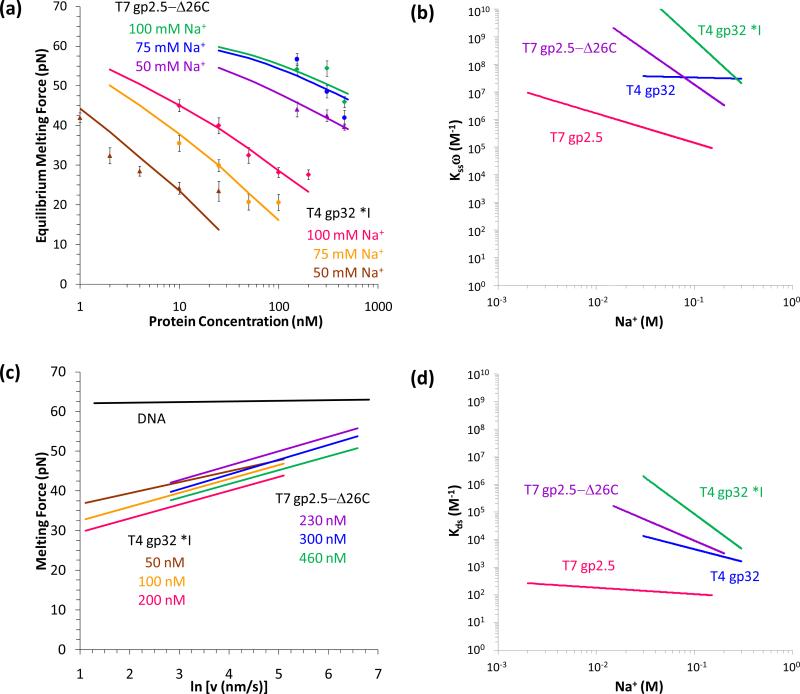
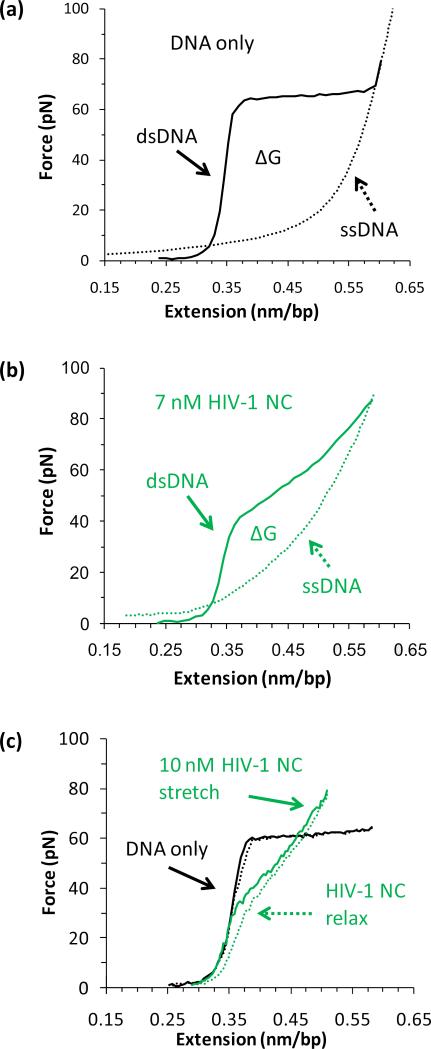
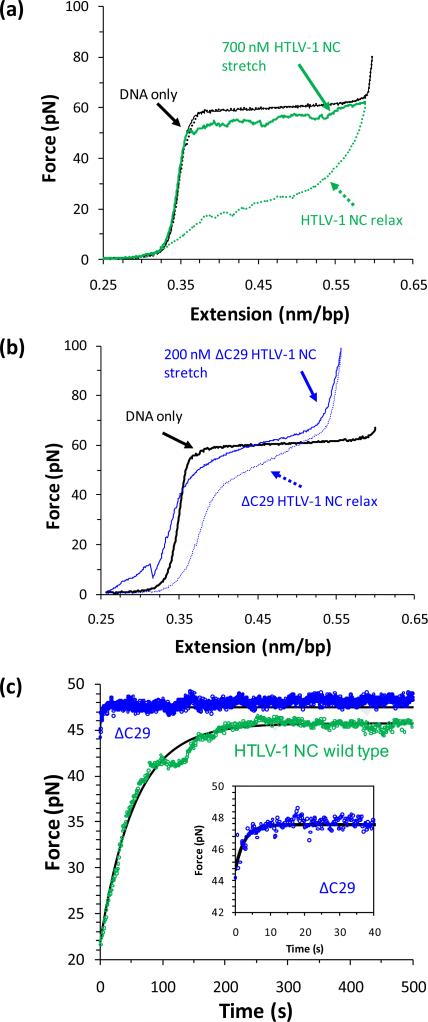
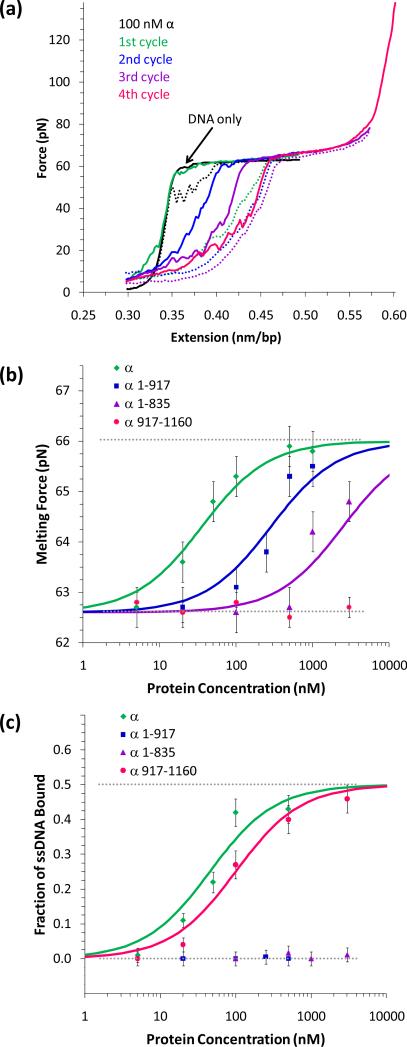
Single molecule force spectroscopy is a powerful method that uses the mechanical properties of DNA to explore DNA interactions. Here we describe how DNA stretching experiments quantitatively characterize the DNA binding of small molecules and proteins. Small molecules exhibit diverse DNA binding modes, including binding into the major and minor grooves and intercalation between base pairs of double-stranded DNA (dsDNA). Histones bind and package dsDNA, while other nuclear proteins such as high mobility group proteins bind to the backbone and bend dsDNA. Single-stranded DNA (ssDNA) binding proteins slide along dsDNA to locate and stabilize ssDNA during replication. Other proteins exhibit binding to both dsDNA and ssDNA. Nucleic acid chaperone proteins can switch rapidly between dsDNA and ssDNA binding modes, while DNA polymerases bind both forms of DNA with high affinity at distinct binding sites at the replication fork. Single molecule force measurements quantitatively characterize these DNA binding mechanisms, elucidating small molecule interactions and protein function.


Figures

Figure 1
Figure 1
DNA stretching experiments measure the force on a dsDNA molecule as a function of extension. The extension data for a typical λ-DNA molecule is shown as a solid black line, and a dotted line represents the relaxation data. The Worm-Like Chain (WLC) model (green line) describes dsDNA. Near the dsDNA contour length, the molecule undergoes a force-induced melting transition, from dsDNA to ssDNA. The Freely-Jointed Chain (FJC) model describes ssDNA (blue line). Minimal hysteresis is evident in these solution conditions (100 mM Na+, 10 mM Hepes, pH = 7.5, T = 20 °C).
Figure 2
Figure 2
Glyoxal binds ssDNA bases exposed in the force-induced melting transition. (a) Extension (solid line) and relaxation (dotted line) data of a λ-DNA molecule alone is shown in black. After the addition of 500 mM glyoxal, the molecule is extended (solid green line) and held fixed (green dotted arrow) for ~30 min. The significant hysteresis upon relaxation (dotted green line) reflects that the two DNA strands do not reanneal, indicating glyoxal binding to exposed nucleotides. The second stretch (solid blue line) follows the previous relaxation curve, which suggests that modification is permanent. (b) Relaxation data (open circles) for a series of fixed extensions (dotted arrows), in which the DNA molecule is stretched in the presence of 500 nM glyoxal. Fits to a linear combination of the WLC and FJC models (Equation (3)) are shown as solid lines. Figures reproduced with permission from [1].
Figure 3
Figure 3
Fractional increase in contour length (right) and persistence length (left) of the DNA-ligand complex for different drugs that exhibit a variety of binding modes, obtained from three types of fits to the WLC model (Equation (1)). Low force limit fits are shown in blue bars [58], high force limit fits are shown in brown bars [59, 66], and fits at drug saturation are shown in green bars [55]. Concentrations are relatively high (~1 μM) with the exception of saturated concentrations, which depends on the drug, and beneril, for which high concentration studies (HC) are at 3 μM and low concentrations studies (LC) are at 0.3 μM. The minor grove binders (drug names shaded yellow) show minor change in contour length, increase in persistence length in the low force limit and decrease in persistence length in the high force limit. Major groove binders (names shaded purple) show no change in contour length and decrease in persistence length. Intercalators (names shaded light blue) and bis-intercalator (names shaded gray) exhibits an increase in contour length and decrease in persistence length.
Figure 4
Figure 4
(a) DNA stretching curves in the presence of different ethidium bromide concentrations shows the increase in melting force, shortening of the melting transition with increasing concentration, and vanishing of the melting transition at a critical concentration around 25 nM. (b) The dependence of melting force on ethidium bromide concentration separates the two phases of the DNA (dsDNA shaded area in blue and ssDNA shaded area in green). The phase diagram shows that beyond 25 nM these phases cannot be distinguished by stretching experiments. Figures adopted from [12].
Figure 5
Figure 5
(a) Fractional elongation per base pair (ν) as a function of ethidium bromide concentration c, fit to the McGhee von Hippel model at different forces F. (b) Force-dependent binding constants KF obtained from the fits shown in (a) yield the zero force binding constant K0 and the DNA lengthening upon a single intercalation event Δx.
Figure 6
Figure 6
Binding site size n in base pairs (blue), lengthening upon a single intercalation event Δx in 0A (brown) and log of the zero force binding constant K0 in M-1 (green) estimated for ethidium, Ru(phen)32+, Ru(phen)2dppz2+, YO, and triostin using the method of Vladescu et al. [55] for molecules reported in [55, 66, 73].
Figure 7
Figure 7
(a) Extension measurements (open circles) as a function of time obtained at constant forces of 28 pN (red), 44 pN (yellow), 48 pN (green), 54 pN (blue) and 59 pN (purple) in the presence of threading intercalator ΔΔ-[μ-bidppz(phen)4Ru2]4+ and single exponent fits (solid lines) to these measurements. (b) Characteristic time constants (green circles) obtained from the fits in (a) for corresponding constant force measurements. Exponential dependence on force (fit, red line) yields the key result that only one base pair must melt in order for this molecule to thread through the DNA bases. Figures adopted from [70].
Figure 8
Figure 8
Distortions in the structure of DNA induced by HMGB family proteins. (a) The crystal structure of a single HMGB box motif is shown here for HMG-D from D. melanogaster [123]. Three helices and positively charged C-terminus become more ordered upon binding to DNA. The protein binds along the minor groove, intercalates into and induces a bend of ~ 111° over a region of ~ 7 base pairs (PDB code: 1QRV). Double box motifs are consecutively joined. (b) Extension data for a single molecule of phage-λ DNA (blue circles) and the same molecule in the presence of a solution containing 3 nM human HMGB1(box A+B) (green squares). Four separate extension cycles are shown, as are fits (solid lines) to the average, using the WLC model of Equation (1). Only forces below 45 pN are included for the fitted data, to minimize the effect of melting transition. Fits reveal a decrease in the persistence length of dsDNA from 46 ± 2 nm to 22 ± 2 nm as the protein is added. (c) The persistence length decreases continuously with the addition of single box HMGB2(box A) (blue) or HMGB1(box A+B) (green), and may be fit to the model of Equations (10) and (4) as described in the text. The equilibrium association binding constant per ligand is determined to be 5.9 (± 1.6) × 108 M-1 for HMGB1(box A+B) and 0.15 (± 0.06) × 108 M-1 for HMGB2(box A). Open symbols are persistence lengths from control fits to the same DNA molecules in the absence of protein [1, 12]
Figure 9
Figure 9
Force microscopy reveals the distributions of bending angles. (a) Gradient surface scans of three DNA molecules in an HMG solution fixed to a mica surface and observed with an oscillating cantilever AFM. The green box frames a single DNA molecule and includes two cross slices. (b) Measured height profiles along cross slice one (black) and slice two (red). Along slice one, bound HMGB proteins are clear as bright spots in the surface image, which correlate to 0.6 nm changes in height. No proteins appear bound along slice two. The angle subtended by the backbone across these bound proteins may be measured directly. (c) Distribution of measured bending angles for HMGB1(box A+B) shows an average induced bending angle of 67 ± 1° (standard error). d) A larger average induced bending angle of 78 ± 1° may be deduced from the distribution for DNA in the presence of HMGB2(box A). The widths of the distributions for both proteins indicate a wide range of angles induced by protein binding [142].
Figure 10
Figure 10
HMG proteins stabilize dsDNA. (a) Cycles of extension (solid lines) and relaxation (dotted lines) for DNA in the presence of no protein (black) and 2 nM (blue), 4 nM (green), 10 nM (yellow) and 100 nM (red) of human HMGB1(box A+B). The graph is split along the dotted line; data to the right is expanded along the scale shown. The observed melting force increases with escalating protein binding. Moderate hysteresis indicates some protein unbinding during the melting transition. (b) Stretching and relaxation data for DNA in the presence of no protein (black) and 2 nM (blue), 4 nM (green), 10 nM (yellow) and 100 nM (red) of rat HMGB2(box A). Stabilization of dsDNA requires greater amounts of the single box protein. Significant hysteresis is observed for high protein concentration, as protein–protein contacts must be dislocated for melting to occur. (c) The increase in the observed melting force as a binding assay for HMGB proteins. The averaged midpoint of the melting force plotted versus protein concentration for HMGB1(box A+B) (green) and HMGB2(box A) (blue). Error bars reflect instrumental uncertainty and standard deviations from a minimum of four individual extension curves. Fits are to the binding model of Equations (10) and (4), as described in the text. Fits determine an equilibrium association binding constant per ligand of 7.2 ± 1.7 × 10⁸ M-1 for HMGB1(box A+B) and 0.28 ± 0.10 × 10⁸ M-1 for HMGB2(box A).
Figure 11
Figure 11
Equilibrium melting forces for DNA with bacteriophage SSBs T7 gp2.5 (left) and T4 gp32 (right). (a) DNA stretching (solid line) and relaxation (dotted line) curves in the absence of protein (black) and in the presence of 30 μM T7 gp2.5 at DNA pulling rates of 250 nm/s (green) and 25 nm/s (purple). Force-extension curves in the presence of the C-terminal truncate 300 nM T7 gp2.5-Δ26C shown at DNA pulling rates of 25 nm/s (blue) and 250 nm/s (pink). Solid lines with dark colors show stretching data, and dotted lines with light colors represent relaxation curves. (b) Force as a function of time at extensions fixed during stretching (filled circles) and relaxation (open circles). Data in the absence of protein is shown in black, data in the presence of 10 μM T7 gp2.5 is green, and data in the presence of 80 nM gp2.5-Δ26C is blue. (c) DNA stretching (solid line) and relaxation (dotted line) curves in the absence of protein (black) and in the presence of 200 nM T4 gp32 (green) and its CTD deletion mutant *I (blue) at a DNA pulling rate of 100 nm/s. (d) Time-dependent force measured at fixed extension in the absence of protein (black) and in the presence of 200 nM gp32 (green filled circles) or 200 nM *I (blue filled circles). Forces measured at a fixed position during relaxation are in light colored open circles. Figure is adapted from [26].
Figure 12
Figure 12
Equilibrium DNA binding for T7 gp2.5 and T4 gp32 and their CTD truncates as a function of salt concentration. (a) Equilibrium melting force as a function of protein concentration for mutants T4 gp32 *I (green, blue, and purple,) and T7 gp2.5-Δ26C (pink, orange, and brown) in 100 mM, 75 mM and 50 mM Na+. Fits to Equation (13) are shown as solid lines. (b) Equilibrium association binding constants to ssDNA for mutants T4 gp32 *I (green) and T7 gp2.5-Δ26C (green), along with wild type SSBs T4 gp32 (red) and T7 gp2.5 (blue). (c) DNA melting force is only weakly dependant on pulling rate in the absence of protein (black). Fits to Equation (14) of DNA melting force as a function of pulling rate in the presence of CTD truncates T4 gp32 *I and T7 gp2.5-Δ26C at various protein concentration. (d) Equilibrium association binding constant to dsDNA as a function of protein concentration for mutants T4 gp32 *I (green) and T7 gp2.5-Δ26C (green), along with wild type SSBs T4 gp32 (red) and T7 gp2.5 (blue). Figure is reproduced with permission from [1].
Figure 13
Figure 13
HIV-1 NC lowers the free energy of DNA melting ΔG. (a) Force-extension curve of dsDNA (solid line), and the FJC model (Equation (2)) for ssDNA stretching (dotted line, Springer chapter ref 56). (b) Stretching curves of dsDNA (solid line) and ssDNA (dotted line, [253]) in the presence of 7 nM HIV-1 NC. (c) Stretching curves of dsDNA extension (solid lines) and relaxation (dotted lines) in the absence of protein (black) and in the presence of 10 nM HIV-1 NC (green) [258].
Figure 14
Figure 14
The CTD of HTLV-1 NC regulates DNA dissociation kinetics. (a) DNA extension (solid line) and relaxation (dotted line) curves in the absence of protein (black) and in the presence of 700 nM HTLV-1 NC wild type (green). (b) DNA extension (solid line) and relaxation (dotted line) curves in the absence of protein (black) and in the presence of 200 nM ΔC29 HTLV-1 NC. (c) Force as a function of time at fixed extension during DNA relaxation (open circles) in the presence of 700 nM wild type HTLV NC (green) and 200 nM ΔC29 (blue), fit to single exponentials (solid black lines). Inset shows ΔC29 data on a shorter time scale. Figures adapted from [248].
Figure 15
Figure 15
E. coli DNA polymerase alpha binds ssDNA and dsDNA at distinct binding sites. (a) Extension (solid lines) and relaxation (dotted lines) cycles in the presence of 100 mM α. Although the initial extension curve (solid green line) is similar to that of DNA without protein (black), the relaxation (dotted green line) exhibits significant hysteresis, indicating that α remains bound to ssDNA and prevents reannealing. Subsequent stretches reflect that some protein remains bound, stabilizing a fraction of ssDNA over the length of the molecule. (b) Increase in DNA melting force characterizes dsDNA binding, and solid lines are fits to the McGhee-von Hippel binding isotherm (Equation (4)) which yield equilibrium association constants Kds for each construct. (c) Relaxation data fit to the WLC and FJC polymer models yields equilibrium association constants Kss for each construct. Full-length α (green) has strong binding affinity for both single- and double-stranded DNA. Both the α1-917 (blue) and α1-835 (purple) fragments show strong dsDNA binding, and no affinity for ssDNA. In contrast, α917-1160 (pink) binds ssDNA but not dsDNA. Figures reproduced with permission from [1].

Comment in

Similar articles

Cited by

References

    1. McCauley MJ, Williams MC. Review: Optical Tweezers Experiments Resolve Distinct Modes of DNA-Protein Binding. Biopolymers. 2009;91:265–282. - PMC - PubMed
    1. Gosse C, Croquette V. Magnetic tweezers: Micromanipulation and force measurement at the molecular level. Biophysical Journal. 2002;82:3314–3329. - PMC - PubMed
    1. Zhang W, Machon C, Orta A, Phillips N, Roberts CJ, Allen S, Soultanas P. Single-molecule atomic force spectroscopy reveals that DnaD forms scaffolds and enhances duplex melting. Journal of Molecular Biology. 2008;377:706–714. - PMC - PubMed
    1. Clausen-Schaumann H, Rief M, Tolksdorf C, Gaub HE. Mechanical stability of single DNA molecules. Biophysical Journal. 2000;78:1997–2007. - PMC - PubMed
    1. Kasas S, Thomson NH, Smith BL, Hansma HG, Zhu XS, Guthold M, Bustamante C, Kool ET, Kashlev M, Hansma PK. Escherichia coli RNA polymerase activity observed using atomic force microscopy. Biochemistry. 1997;36:461–468. - PubMed

Publication types

MeSH terms

LinkOut - more resources