. 2010 Aug 27;285(35):26842-26851.
doi: 10.1074/jbc.M109.093542. Epub 2010 Jun 24.

Heparan sulfate domain organization and sulfation modulate FGF-induced cell signaling

Affiliations

Heparan sulfate domain organization and sulfation modulate FGF-induced cell signaling

Nadja Jastrebova et al. J Biol Chem. .

Abstract

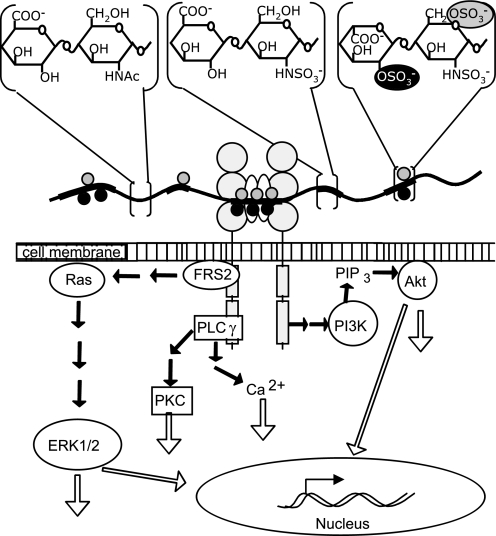
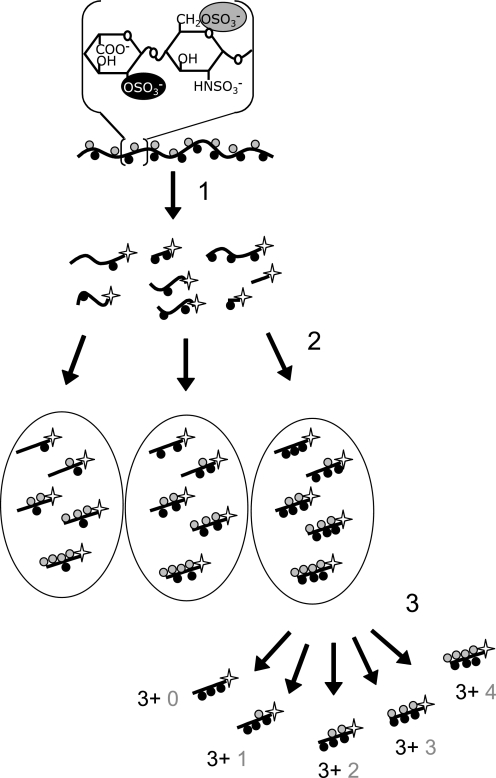
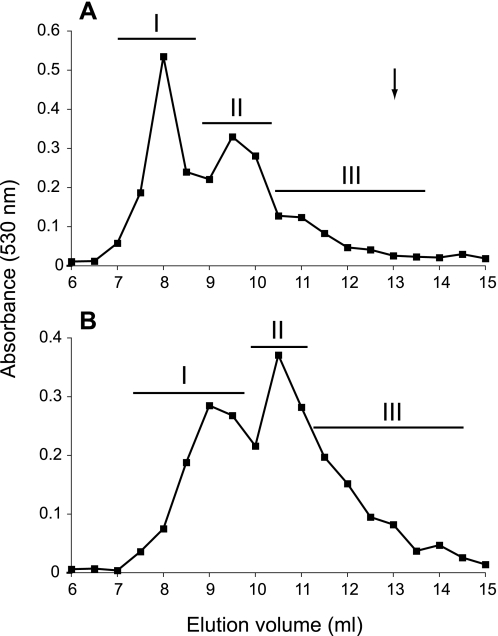
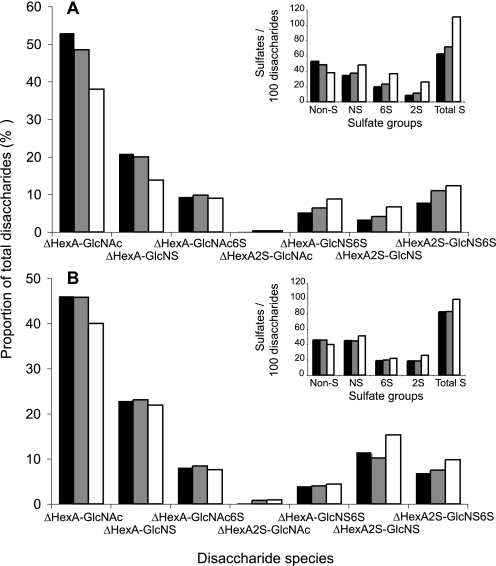
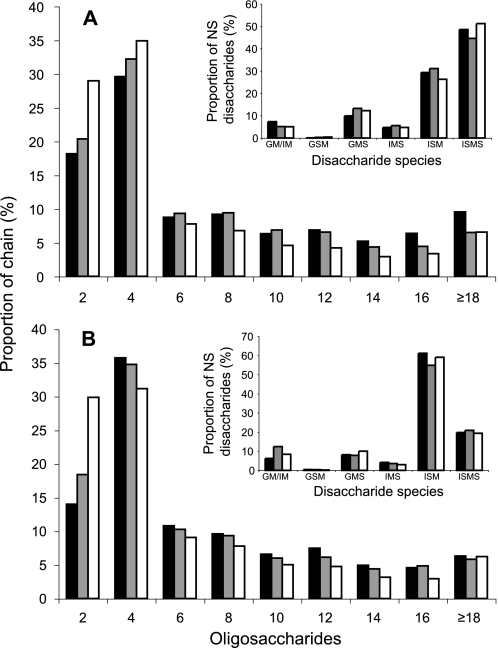
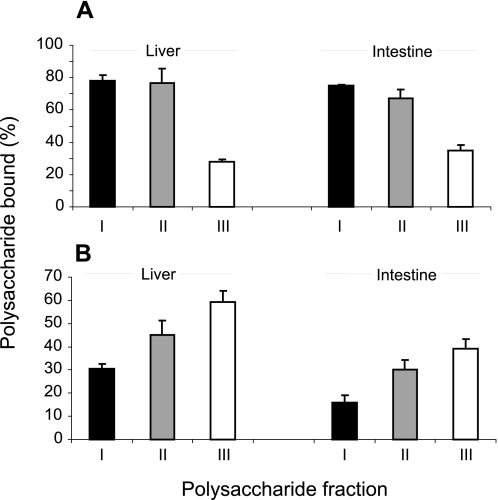
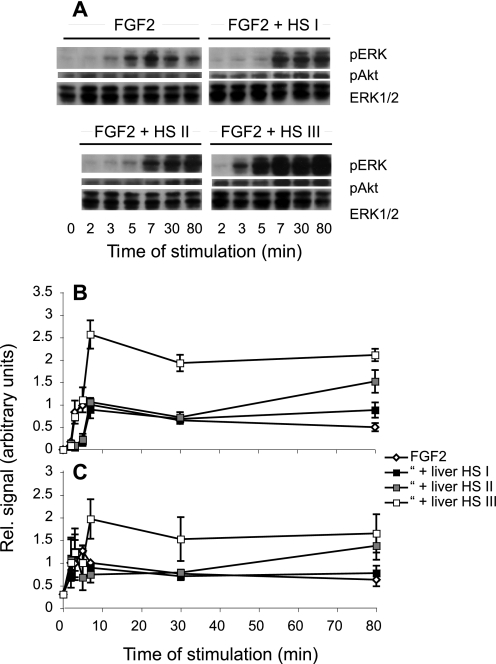
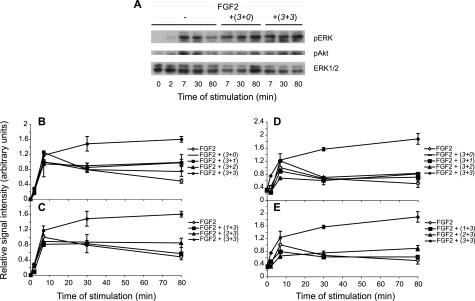
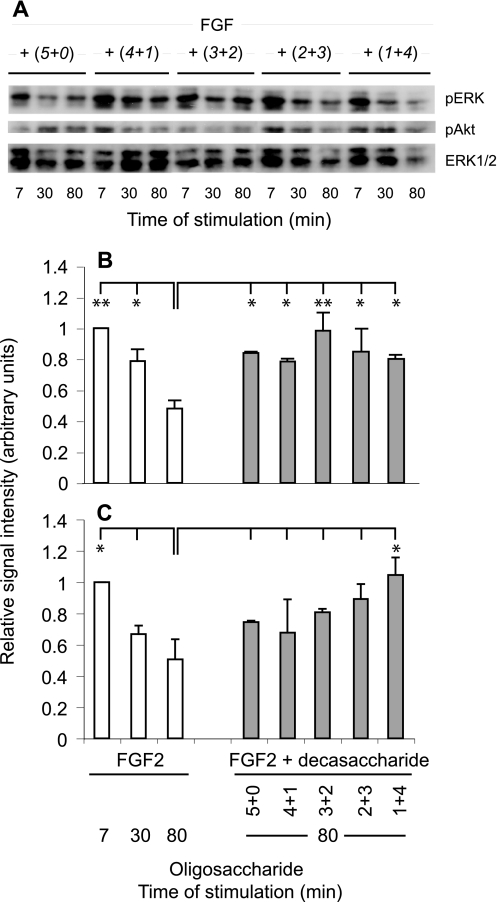
Heparan sulfates (HSs) modulate various developmental and homeostatic processes by binding to protein ligands. We have evaluated the structural characteristics of porcine HS in cellular signaling induced by basic fibroblast growth factor (FGF2), using CHO745 cells devoid of endogenous glycosaminoglycans as target. Markedly enhanced stimulation of cell signaling, measured as phosphorylation of ERK1/2 and protein kinase B, was only observed with the shortest HS chains isolated from liver, whereas the longer chains from either liver or intestine essentially prolonged duration of signals induced by FGF2 in the absence of polysaccharide. Structural analysis showed that contiguous sulfated domains were most abundant in the shortest HS chains and were more heavily sulfated in HS from liver than in HS from intestine. Moreover, the shortest chains from either source entered into ternary complexes with FGF2 and FGF receptor-1c more efficiently than the corresponding longer chains. In addition to authentic HSs, decasaccharide libraries generated by chemo-enzymatic modification of heparin were probed for effect on FGF2 signaling. Only the most highly sulfated decamers, previously found most efficient in ternary complex formation (Jastrebova, N., Vanwildemeersch, M., Rapraeger, A. C., Giménez-Gallego, G., Lindahl, U., and Spillmann, D. (2006) J. Biol. Chem. 281, 26884-26892), promoted FGF2 cellular signaling as efficiently as short HS chains from liver. Together these results suggest that the effects of HS on FGF2 signaling are determined by both the structure of the highly sulfated domains and by the organization/availability of such domains within the HS chain. These findings underpin the need for regulation of HS biosynthesis in relation to control of growth factor-induced signaling pathways.


Figures

FIGURE 1.
FIGURE 1.
Schematic presentation of HS chain participating in FGF·HS·FR complex formation and induction of intracellular signaling pathways. The HS backbone is symbolized as a cord containing unmodified NA domains (thin gray stretches) and modified NS domains (broad black stretches). Black circles on the cord represent 2-O-sulfate groups, and gray circles represent 6-O-sulfate groups. The highest modified part of the HS chain in the middle is participating in an FGF·HS·FR complex formation, where white ovals represent FGF molecules. The large gray circles symbolize the extracellular immunoglobulin-like domains I–III of the receptor, and the gray rectangles inside the cell represent the receptor kinase domains, which can trigger several signaling pathways. The flowchart sketches three main FGF- induced signaling pathways, the MAPK-ERK1/2, PI3K-Akt, and phospholipase Cγ (PLC)γ pathways. PIP, inositol 1,4,5-trisphosphate.
FIGURE 2.
FIGURE 2.
Chemo-enzymatic generation of oligosaccharide libraries. The starting material, heparin, is symbolized as a string cord with the predominant repeating disaccharide unit indicated. Step 1, after selective O-desulfation by solvolysis (designed to remove all 6-O-sulfate groups and about half of the 2-O-sulfate groups), chains are subjected to partial deaminative cleavage, and the resultant oligosaccharides are radiolabeled by reduction with NaB3H4 (star indicates the radiolabeled reduced end of oligosaccharide). Step 2, size and charge selections are performed before enzyme-based 6-O-sulfation of pools of different oligosaccharides. Step 3, fractions of size-homogeneous oligosaccharides with a given number of 2-O-sulfate groups (1st digit; dark circle) and variable numbers of added 6-O-sulfate groups (2nd digit; gray circle) are further separated by anion-exchange chromatography.
FIGURE 3.
FIGURE 3.
Sizing chromatography of HS isolated from porcine tissues. HS isolated from liver (A) and intestine (B) were separated by chromatography on a Superose 12 column. Fractions were collected, assayed for uronic acid content, and pooled into three subpopulations as indicated by bars. The arrow indicates the elution position of a size-defined 26-mer heparin oligosaccharide.
FIGURE 4.
FIGURE 4.
Disaccharide composition of HS chains assessed following extensive heparin lyase cleavage. HS from liver (A) and intestine (B) subpopulations was completely degraded to disaccharides by a mixture of heparin lyases. Disaccharides were analyzed by reversed-phase ion pairing-HPLC and fluorescent detection after post-column condensation with cyanoacetamide and quantified against standard disaccharides (6). The different disaccharide species are plotted as percent of all lyase-generated disaccharides. Insets, overall numbers of nonsulfated (Non-S), N-sulfated (NS), 2-O-sulfated (2S), and 6-O-sulfated (6S) disaccharides/100 disaccharides were calculated, and the resulting overall degree of sulfation is shown (Total S). Black bars represent pool I, gray bars pool II, and white bars pool III of each HS preparation.
FIGURE 5.
FIGURE 5.
HS domain content and disaccharide composition assessed by deamination at pH 1. 5. HS pool I (black), pool II (gray), and pool III (white) from liver (A) and intestine (B) were treated with HNO2 at pH 1.5, and the products were reduced with NaB3H4. The resulting end-labeled oligosaccharides were analyzed on an FPLC system as described under “Experimental Procedures.” Peak areas, multiplied by factors corresponding to the number of disaccharide units in the respective oligosaccharides, were used to calculate the contribution of each species to intact chains. The disaccharide fractions were further analyzed by strong anion-exchange HPLC (insets), and the proportion of the different disaccharide species was calculated. GM, glucuronate-anhydromannitol; IM, iduronate-anhydromannitol; GSM, glucuronate-2-O-sulfate-anhydromannitol; GMS, glucuronate-anhydromannitol-6-O-sulfate; IMS, iduronate-anhydromannitol-6-O-sulfate; ISM, iduronate-2-O-sulfate-anhydromannitol; ISMS, iduronate-2-O-sulfate-anhydromannitol-6-O-sulfate.
FIGURE 6.
FIGURE 6.
Formation of binary FGF2·HS and ternary FGF2·HS·FR1c complexes. A, binding between FGF-2 and size-fractionated HS subpopulations. Approximately equal molar amounts of 3H N-acetylated HS pools I (black), II (gray), and III (white) from liver and intestine were incubated with FGF2. Protein along with bound HS was retrieved on nitrocellulose filters, and the retained saccharides were determined as radioactive counts. Results are presented as proportion retained saccharides of the total amounts applied. B, ternary complex formation between FGF, FR1c, and HS pools. Approximately equal molar amounts of liver and intestine HS pools I–III were loaded together with FGF2 to a FR1c column, incubated, and eluted with increasing salt concentrations. Results are presented as the proportion of the total amounts of each saccharide applied that was eluted at >0.15–2.0 m NaCl. Standard means ± S.E. were calculated from three experiments.
FIGURE 7.
FIGURE 7.
Effect of liver HS pools on FGF2-induced ERK1/2 and Akt phosphorylation. CHO745 cells, lacking endogenous HS and CS, were activated with FGF2 (10 ng/ml) alone or together with liver HS pools (9, 5, and 3 ng/ml of pools I–III, respectively). Incubation was interrupted after the indicated periods of time by addition of boiling sample buffer, and cell lysates were separated on SDS-PAGE and analyzed by Western blotting, as described under “Experimental Procedures.” Blots are shown from one experiment in A, and the quantified signals for phosphorylation of ERK1/2 (B) and Akt (C) from at least three independent experiments are plotted against time. Standard means ± S.E. were calculated from three independent experiments.
FIGURE 8.
FIGURE 8.
Cell activation by FGF2 and decasaccharides with different numbers of O-sulfate groups. CHO745 cells were incubated for the indicated periods of time with FGF2 (10 ng/ml), either alone or in the presence of oligosaccharides (∼1 ng/ml) with the specified numbers of 2-O- and 6-O-sulfate groups (see Fig. 2 for designation). Stimulation of CHO745 cells was interrupted at the time points indicated, and cell lysates were analyzed as in Fig. 7. Representative blots are shown in A. Results from several experiments were quantified and plotted versus stimulation time for phospho-ERK (B and C) and phospho-Akt (D and E). Values are averages of 2 to 3 repeat experiments. For the sake of clarity, the data sets for each target protein are presented in two separate panels with the curves for FGF and FGF + (3 + 3) oligosaccharides from the same experimental series indicated in both panels for comparison.
FIGURE 9.
FIGURE 9.
Cell activation by FGF2 and decasaccharides with the same total number of O-sulfate groups. Results were obtained as described in Fig. 8. A, representative Western blot of protein extracts incubated with anti-pERK, anti-pAkt, and anti-ERK1/2, respectively. B, phospho-ERK1/2; C, phospho-Akt levels at the indicated time points following stimulation with FGF2 alone or after 80 min of stimulation in the presence of FGF2 and the indicated decasaccharides. Values are averages of three repeat experiments. Statistical comparison was performed between the indicated pairs and reached significance where indicated with p < 0.01 (**) and p < 0.05 (*).

Similar articles

Cited by

References

    1. Bernfield M., Götte M., Park P. W., Reizes O., Fitzgerald M. L., Lincecum J., Zako M. (1999) Annu. Rev. Biochem. 68, 729–777 - PubMed
    1. Iozzo R. V. (2005) Nat. Rev. Mol. Cell Biol. 6, 646–656 - PubMed
    1. Esko J. D., Lindahl U. (2001) J. Clin. Invest. 108, 169–173 - PMC - PubMed
    1. Gallagher J. T. (2001) J. Clin. Invest. 108, 357–361 - PMC - PubMed
    1. Maccarana M., Sakura Y., Tawada A., Yoshida K., Lindahl U. (1996) J. Biol. Chem. 271, 17804–17810 - PubMed

Publication types

MeSH terms

Substances

LinkOut - more resources