

Compensatory mutations restore fitness during the evolution of dihydrofolate reductase
- PMID: 20576759
- PMCID: PMC2981517
- DOI: 10.1093/molbev/msq160
Compensatory mutations restore fitness during the evolution of dihydrofolate reductase
Abstract
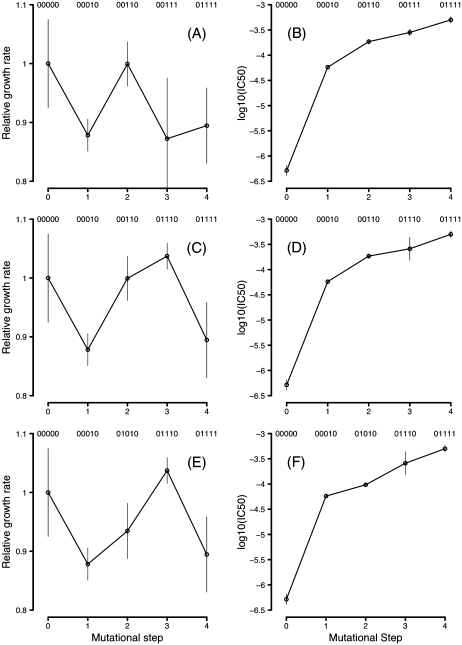
Whether a trade-off exists between robustness and evolvability is an important issue for protein evolution. Although traditional viewpoints have assumed that existing functions must be compromised by the evolution of novel activities, recent research has suggested that existing phenotypes can be robust to the evolution of novel protein functions. Enzymes that are targets of antibiotics that are competitive inhibitors must evolve decreased drug affinity while maintaining their function and sustaining growth. Utilizing a transgenic Saccharomyces cerevisiae model expressing the dihydrofolate reductase (DHFR) enzyme from the malarial parasite Plasmodium falciparum, we examine the robustness of growth rate to drug-resistance mutations. We assay the growth rate and resistance of all 48 combinations of 6 DHFR point mutations associated with increased drug resistance in field isolates of the parasite. We observe no consistent relationship between growth rate and resistance phenotypes among the DHFR alleles. The three evolutionary pathways that dominate DHFR evolution show that mutations with increased resistance can compensate for initial declines in growth rate from previously acquired mutations. In other words, resistance mutations that occur later in evolutionary trajectories can compensate for the fitness consequences of earlier mutations. Our results suggest that high levels of resistance may be selected for without necessarily jeopardizing overall fitness.
Figures


References
-
- Aharoni A, Gaidukov L, Khersonsky O, Gould SM, Roodveldt C, Tawfik DS. The ‘evolvability’ of promiscuous protein functions. Nat Genet. 2005;37:73–76. - PubMed
-
- Andersson DI. The biological cost of antiobiotic resistance: any practical conclusions? Curr Opin Microbiol. 2006;9:461–465. - PubMed
-
- Berkhout B. HIV-1 evolution under pressure of protease inhibitors: climbing the stairs of viral fitness. J Biomed Sci. 1999;6:298–305. - PubMed
-
- Chusacultanachai S, Thiensathit P, Tarnchompoo B, Sirawaraporn W, Yuthavong Y. Novel antifolate resistant mutations of Plasmodium falciparum dihydrofolate reductase selected in Escherichia coli. Mol Biochem Parasitol. 2002;120:61–72. - PubMed
Publication types
MeSH terms
Substances
Grants and funding
LinkOut - more resources
Full Text Sources
Molecular Biology Databases
