Comparative Study
. 2010 Aug 20;107(4):520-31.
doi: 10.1161/CIRCRESAHA.109.212324. Epub 2010 Jun 24.

T-tubule remodeling during transition from hypertrophy to heart failure

Affiliations
Comparative Study

T-tubule remodeling during transition from hypertrophy to heart failure

Sheng Wei et al. Circ Res. .

Abstract

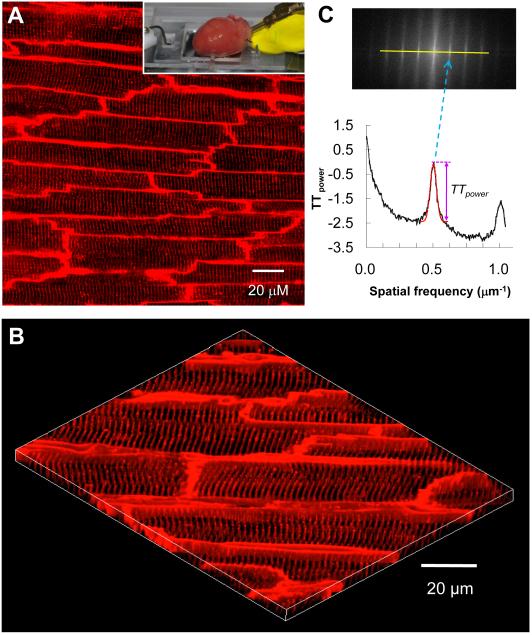
Rationale: The transverse tubule (T-tubule) system is the ultrastructural substrate for excitation-contraction coupling in ventricular myocytes; T-tubule disorganization and loss are linked to decreased contractility in end stage heart failure (HF).

Objective: We sought to examine (1) whether pathological T-tubule remodeling occurs early in compensated hypertrophy and, if so, how it evolves during the transition from hypertrophy to HF; and (2) the role of junctophilin-2 in T-tubule remodeling.

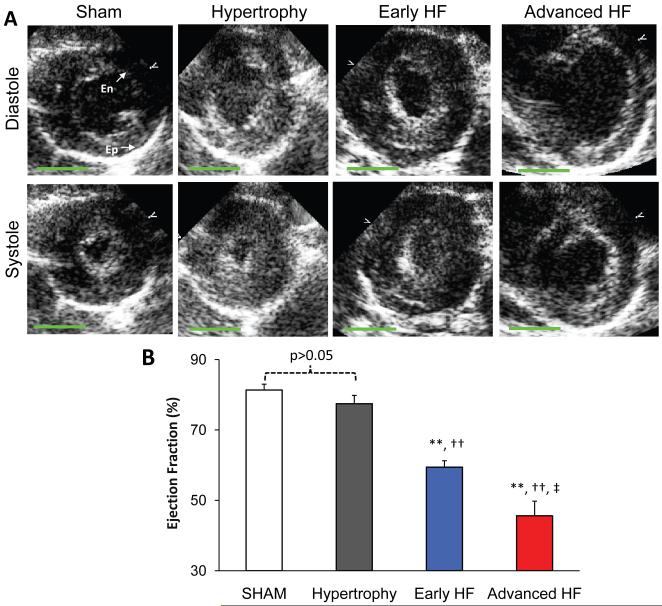
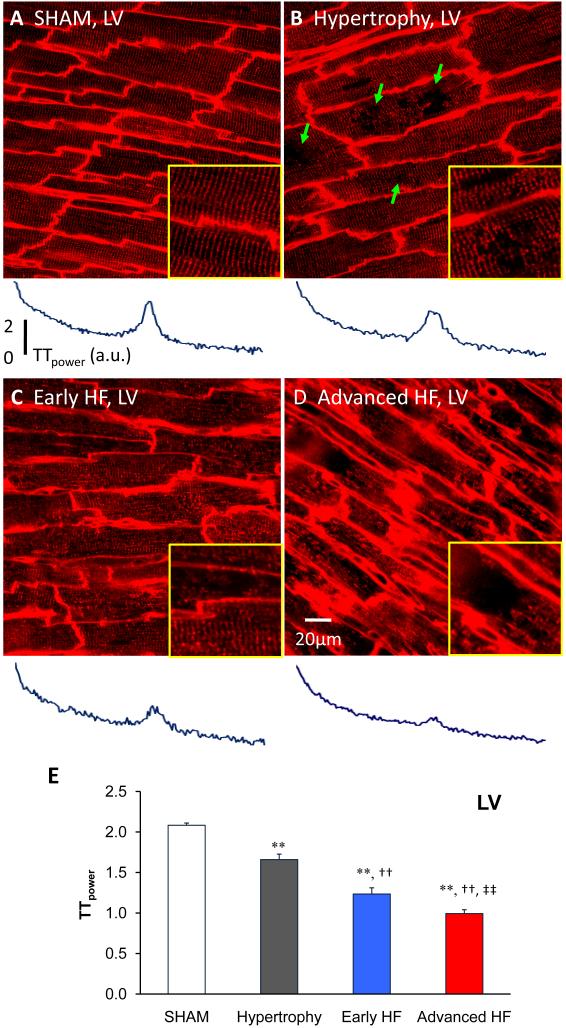
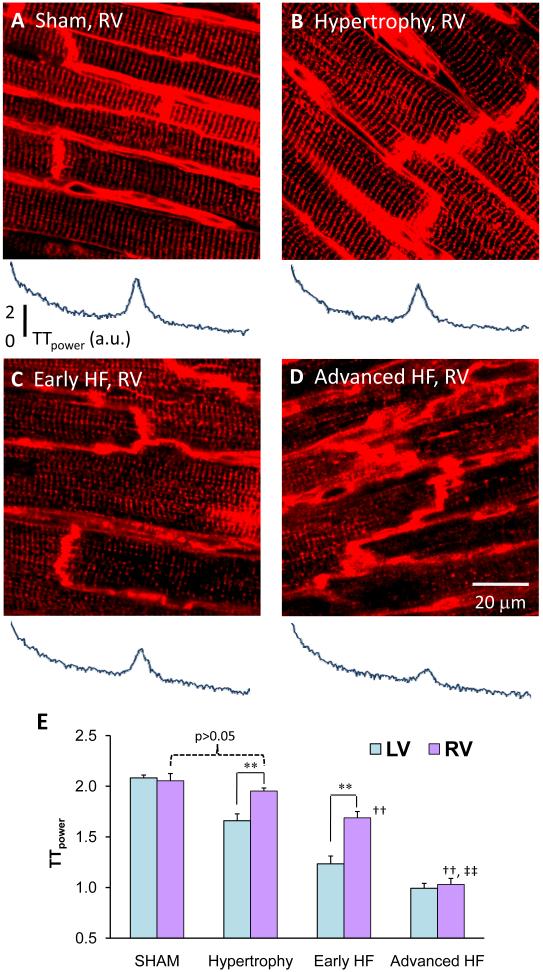
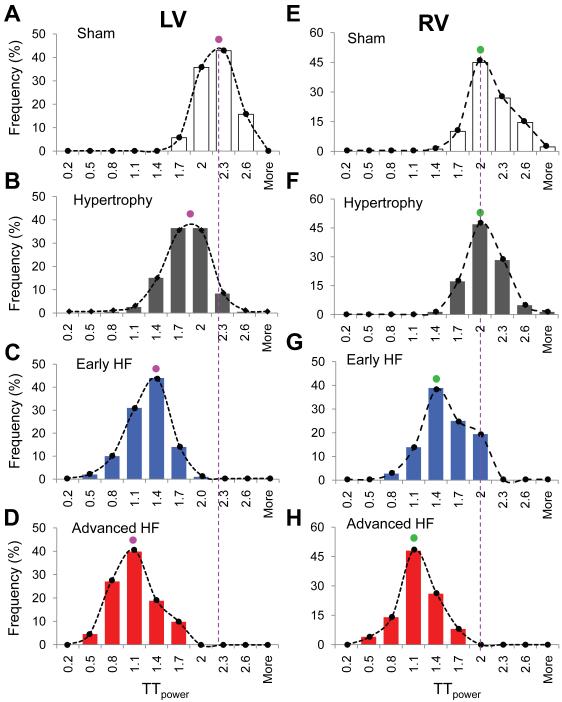
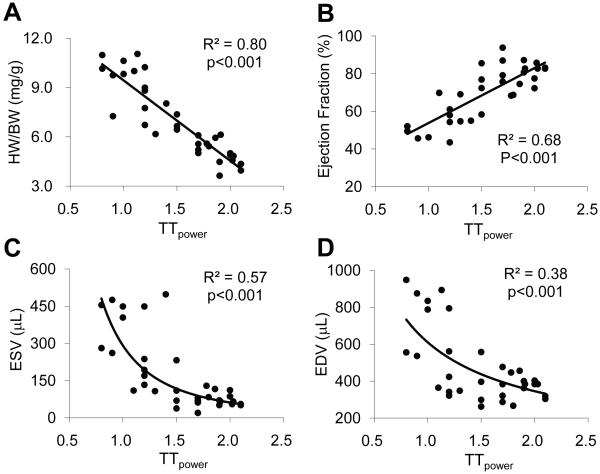
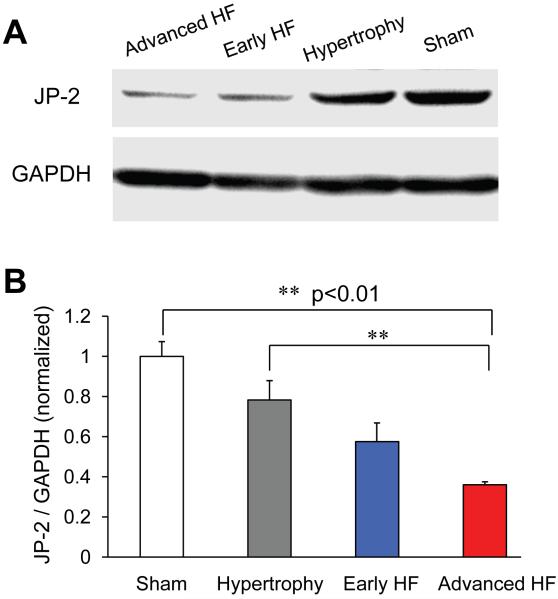
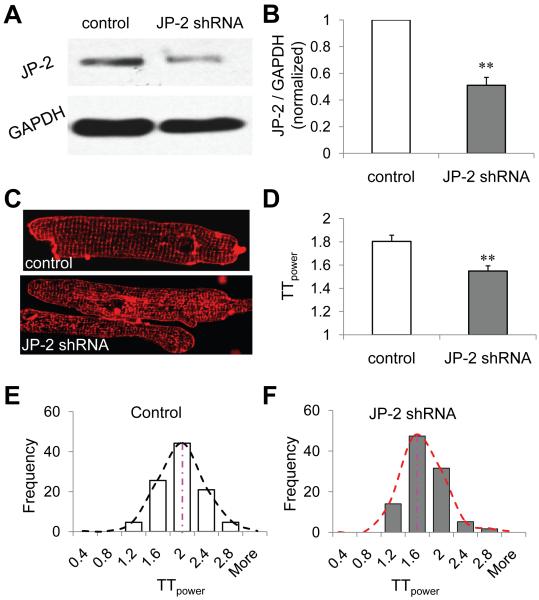
Methods and results: We investigated T-tubule remodeling in relation to ventricular function during HF progression using state-of-the-art confocal imaging of T-tubules in intact hearts, using a thoracic aortic banding rat HF model. We developed a quantitative T-tubule power (TT(power)) index to represent the integrity of T-tubule structure. We found that discrete local loss and global reorganization of the T-tubule system (leftward shift of TT(power) histogram) started early in compensated hypertrophy in left ventricular (LV) myocytes, before LV dysfunction, as detected by echocardiography. With progression from compensated hypertrophy to early and late HF, T-tubule remodeling spread from the LV to the right ventricle, and TT(power) histograms of both ventricles gradually shifted leftward. The mean LV TT(power) showed a strong correlation with ejection fraction and heart weight to body weight ratio. Over the progression to HF, we observed a gradual reduction in the expression of a junctophilin protein (JP-2) implicated in the formation of T-tubule/sarcoplasmic reticulum junctions. Furthermore, we found that JP-2 knockdown by gene silencing reduced T-tubule structure integrity in cultured adult ventricular myocytes.

Conclusions: T-tubule remodeling in response to thoracic aortic banding stress begins before echocardiographically detectable LV dysfunction and progresses over the development of overt structural heart disease. LV T-tubule remodeling is closely associated with the severity of cardiac hypertrophy and predicts LV function. Thus, T-tubule remodeling may constitute a key mechanism underlying the transition from compensated hypertrophy to HF.


Figures

Figure 1
Figure 1. Echocardiographic results of TAB rat heart function
A. Representative echocardiographic images at end diastole and end systole from sham, hypertrophy, early HF and advanced HF rats, respectively. At advanced HF stage, the heart was dilated with severe systolic dysfunction. B. Summary data of EF from different groups. Note: En stands for endocardial border; Ep for epicardial border. **, p<0.01 vs sham; †, p<0.05; ††, p<0.01 vs hypertrophy; ‡, p<0.05; ‡‡, p<0.01 vs early HF. Green bar=5 mm.
Figure 2
Figure 2. In situ confocal imaging of t-tubules on intact rat heart and t-tubule image analysis
A. A typical t-tubule image from the epicardium of Langendorff-perfused intact rat heart (control, sham-operated) loaded with lipophilic membrane indicator FM4-64. The inset illustrates a Langendorff-perfused heart attached to the inverted Zeiss 510 confocal microscope system. B. The periodically organized t-tubules were viewed from a 3D reconstruction of 25 confocal stacks at 0.2 μm interval. Scale bar: 20 μm. C. Power spectrum retrieved from a 2D Fourier transformation of confocal t-tubule image characterized the power magnitude of the regular organization of t-tubule system, in which the first peak located at spatial frequency of ~0.5 μm−1 corresponded to the ~2 μm interval of t-tubules. TTpower was measured as an absolute value using Gaussian fitting around the first peak (the red dashed curve).
Figure 3
Figure 3. Progressive t-tubule remodeling of LV myocytes in TAB rat cardiomyopathy
Representative t-tubule images from LV of age-matched sham operated heart (A), hypertrophy (B), early HF (C) and advanced HF (D). The bottom panels showed the power spectrums obtained from 2D Fourier transform of the raw images above. At hypertrophy stage (B), discrete T-tubule loss (green arrows) was often observed with slight t-tubule disorganization, which caused a mild decrease in TTpower. In moderately de-compensated heart (C), LV myocytes exhibited widely impaired t-tubule system and further decrease in TTpower. At advanced HF stage (D), myocytes lost majority of t-tubules with striated pattern almost vanished, resulting in severe reduction in TTpower. Each yellow-framed inset is a zoom-in view of an area 40×40 μm from associated images. E. Summarized data of LV myocyte t-tubule power (N=7, 12, 7, 7 hearts for sham, hypertrophy, early HF and advanced HF, respectively). Note: **, p<0.01 vs sham; †, p<0.05; ††, p<0.01 vs hypertrophy; ‡, p<0.05; ‡‡, p<0.01 vs early HF.
Figure 4
Figure 4. Delayed t-tubule remodeling in RV myocytes
Representative images acquired from RV epicardium at sham (A), hypertrophy (B), early HF (C) and advanced HF (D) stages. RV myocytes are highly comparable to those of LV in t-tubule structure organization (Figures 4A and 3A). Different from LV t-tubule remodeling (Figure 3B), RV myocytes remained unaffected in t-tubule structure at hypertrophy stage (4B). At early HF stage, RV myocytes started to lose t-tubules and their regular organization (4C), similar to that of LV myocytes at hypertrophy (3B). At advanced HF stages, both LV and RV myocytes were severely damaged (3D & 4D). Bottom panels beneath each image are corresponding power spectrum results. E. Comparison of the TTpower from LV and RV myocytes. RV myocytes from hypertrophy hearts had similar TTpower as RV of sham control (2.05±0.07, N=7 sham vs 1.95±0.03, N=12 hypertrophy, p>0.05), but had greater power than hypertrophied LV (1.66±0.07, p<0.01). At early HF stage, RV myocytes also had larger TTpower than LV (RV 1.69±0.06 vs LV 1.23±0.08, N=7, p<0.01). Note: **, p<0.01 for comparison between LV vs RV; ††, p<0.01 vs hypertrophy (RV); ‡‡, p<0.01 vs early HF (RV).
Figure 5
Figure 5. Histogram distribution of LV and RV myocyte TTpower
A-D (LV), The count numbers at each bin size were normalized by the total images of each group and were shown as frequency. Each panel represents over a thousand of myocytes. An unambiguous, global population shift as well as mode shift was present from sham (A) to advanced HF (D), indicating global t-tubule structure reorganization occurred in both hypertrophy and HF stages. E-H (RV), Different from those of LV myocytes, the mode of RV TTpower distribution and global population were not shifted at hypertrophy stage (E&F). At early (G) and advanced HF (H) stages, a gradual leftward shift in RV TTpower distribution were observed, similar to that of LV myocytes.
Figure 6
Figure 6. Correlation between TTpower and LV function
The LV TTpower was in good linear correlation with HW/BW ratio (R2=0.80, p<0.001) (A) and EF (R2=0.68, p<0.001) (B). Moreover, the LV TTpower was well fitted in power function with end systolic volume (ESV) (R2=0.57, p<0.001) (C) and end diastolic volume (EDV) (R2=0.38, p<0.001) (D).
Figure 7
Figure 7. Junctophilin-2 (JP-2) down-regulation in TAB rats
A, representative examples of JP-2 protein Western Blotting from LV frozen tissues at different disease stages and sham control. B, Summary results of normalized JP-2 protein expression level, showing a progressively reduction in JP-2 protein level in rats in response to pressure overload stress (N=5, 4, 2, 3 hearts for sham, hypertrophy, early HF and advanced HF, respectively).
Figure 8
Figure 8. JP-2 knockdown caused a significant reduction in TTpower in cultured mouse ventricular myocytes
A&B, JP-2 shRNA (64 hrs) knocked down the protein expression level of JP-2 by 49% (n=4, 4 for both control and JP-2 shRNA groups, p<0.01). C&D, JP-2 shRNA transfected myocytes had worse t-tubule organization and a significant reduction in t-tubule integrity than control (p<0.01). E&F, JP-2 shRNA knockdown shifted the TTpower histogram leftward, in comparison with that of scrambled control shRNA infected myocytes (n=57 and 43 cells, respectively).

Comment in

Similar articles

Cited by

References

    1. Wang SQ, Song LS, Lakatta EG, Cheng H. Ca2+ signalling between single L-type Ca2+ channels and ryanodine receptors in heart cells. Nature. 2001;410:592–596. - PubMed
    1. Song LS, Guatimosim S, Gomez-Viquez L, Sobie EA, Ziman A, Hartmann H, Lederer WJ. Calcium biology of the transverse tubules in heart. Ann.N.Y.Acad.Sci. 2005;1047:99–111. - PMC - PubMed
    1. Brette F, Orchard C. T-tubule function in mammalian cardiac myocytes. Circ.Res. 2003;92:1182–1192. - PubMed
    1. Bers DM, Eisner DA, Valdivia HH. Sarcoplasmic reticulum Ca2+ and heart failure: roles of diastolic leak and Ca2+ transport. Circ.Res. 2003;93:487–490. - PubMed
    1. Houser SR, Margulies KB. Is depressed myocyte contractility centrally involved in heart failure? Circ.Res. 2003;92:350–358. - PubMed

Publication types