. 2010 Jul;120(7):2379-94.
doi: 10.1172/JCI41203. Epub 2010 Jun 23.

Neuropilin-1 promotes cirrhosis of the rodent and human liver by enhancing PDGF/TGF-beta signaling in hepatic stellate cells

Affiliations

Neuropilin-1 promotes cirrhosis of the rodent and human liver by enhancing PDGF/TGF-beta signaling in hepatic stellate cells

Sheng Cao et al. J Clin Invest. 2010 Jul.

Abstract

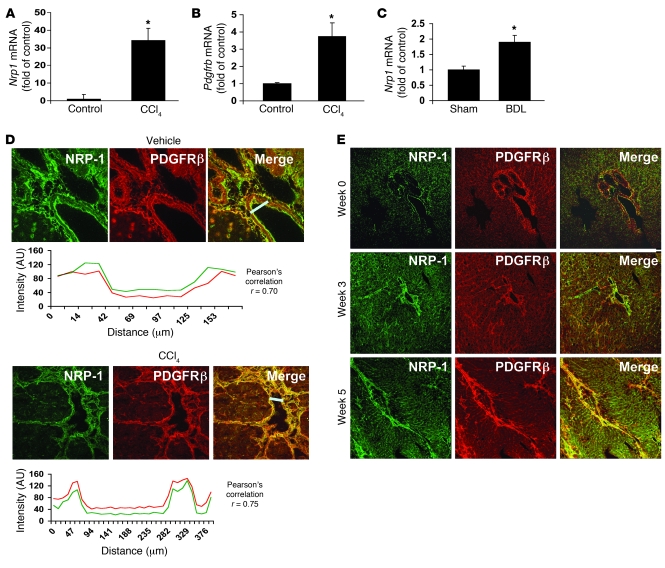
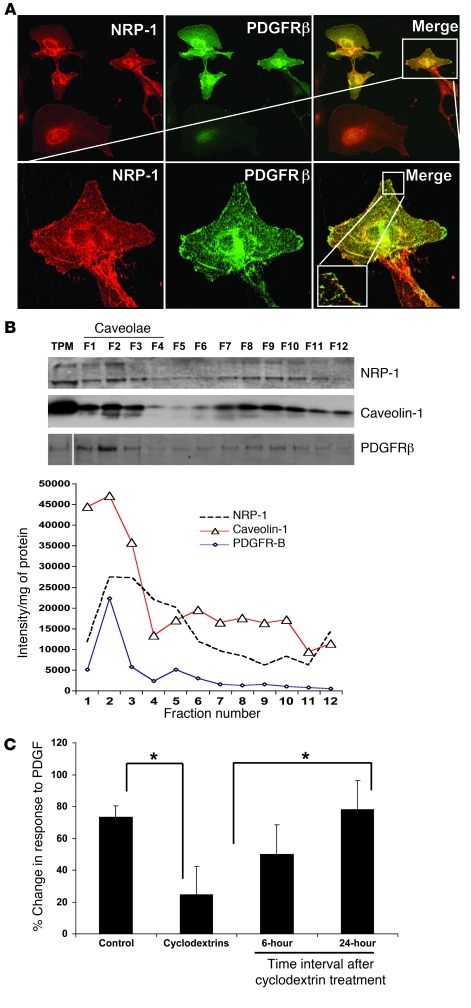
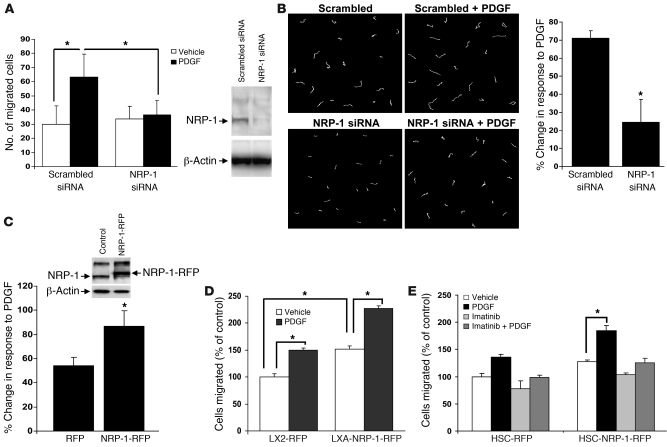
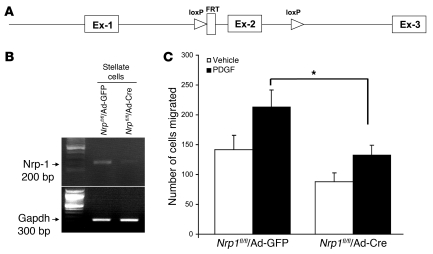
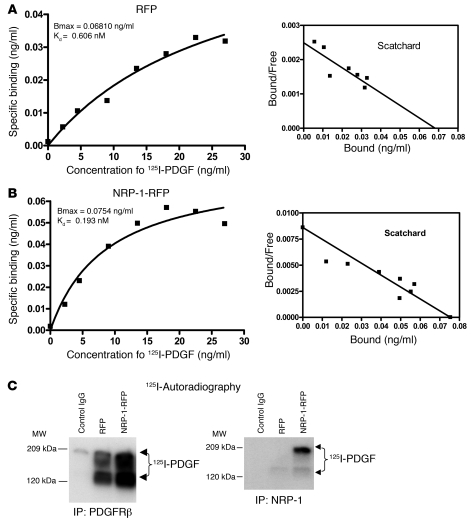
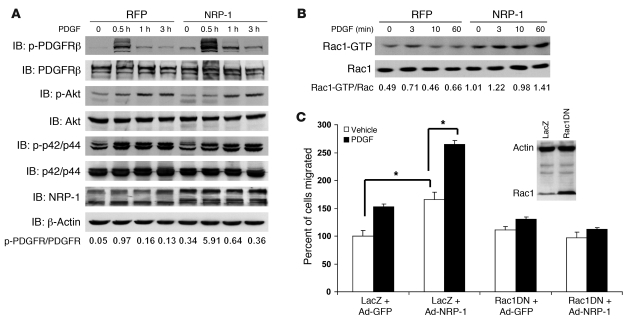
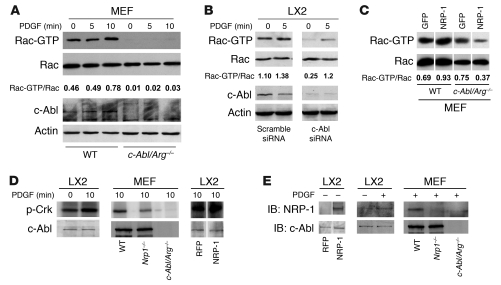
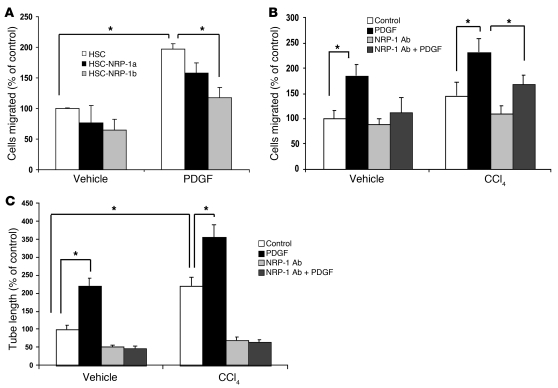
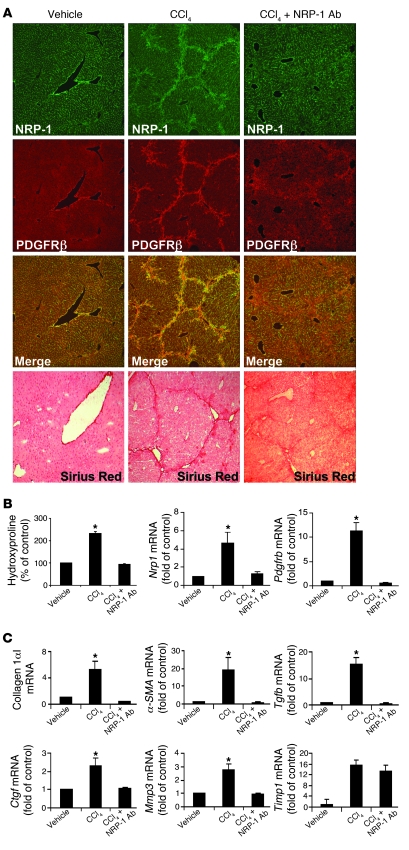
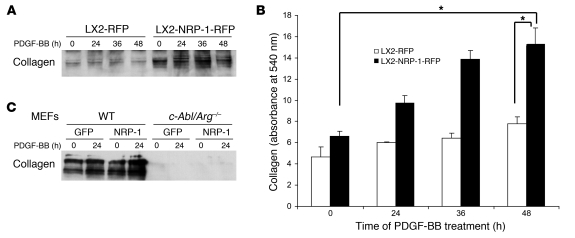
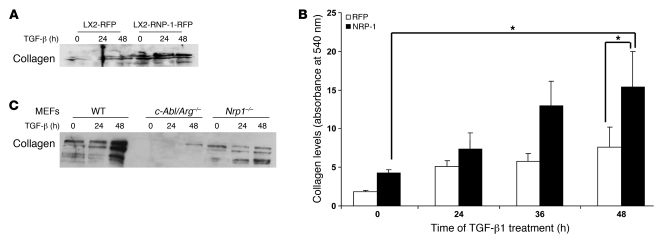
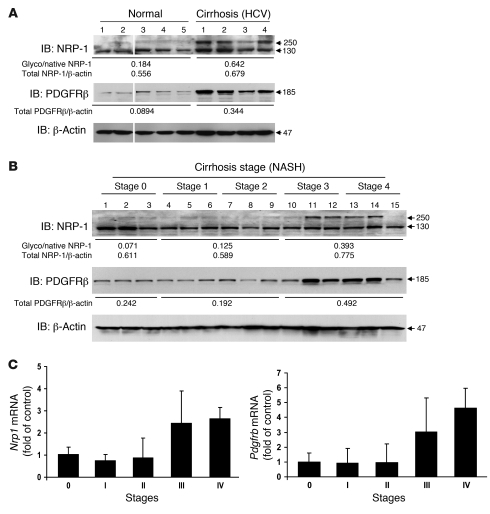
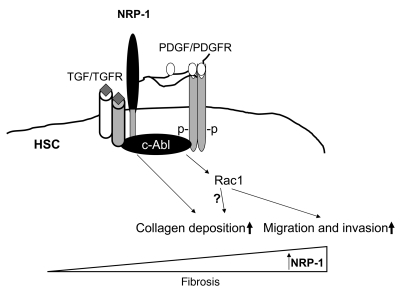
PDGF-dependent hepatic stellate cell (HSC) recruitment is an essential step in liver fibrosis and the sinusoidal vascular changes that accompany this process. However, the mechanisms that regulate PDGF signaling remain incompletely defined. Here, we found that in two rat models of liver fibrosis, the axonal guidance molecule neuropilin-1 (NRP-1) was upregulated in activated HSCs, which exhibit the highly motile myofibroblast phenotype. Additionally, NRP-1 colocalized with PDGF-receptor beta (PDGFRbeta) in HSCs both in the injury models and in human and rat HSC cell lines. In human HSCs, siRNA-mediated knockdown of NRP-1 attenuated PDGF-induced chemotaxis, while NRP-1 overexpression increased cell motility and TGF-beta-dependent collagen production. Similarly, mouse HSCs genetically modified to lack NRP-1 displayed reduced motility in response to PDGF treatment. Immunoprecipitation and biochemical binding studies revealed that NRP-1 increased PDGF binding affinity for PDGFRbeta-expressing cells and promoted downstream signaling. An NRP-1 neutralizing Ab ameliorated recruitment of HSCs, blocked liver fibrosis in a rat model of liver injury, and also attenuated VEGF responses in cultured liver endothelial cells. In addition, NRP-1 overexpression was observed in human specimens of liver cirrhosis caused by both hepatitis C and steatohepatitis. These studies reveal a role for NRP-1 as a modulator of multiple growth factor targets that regulate liver fibrosis and the vascular changes that accompany it and may have broad implications for liver cirrhosis and myofibroblast biology in a variety of other organ systems and disease conditions.


Figures

Figure 1
Figure 1. NRP-1 expression correlates with activation of HSCs into a motile myofibroblastic phenotype.
(A and B) Nrp1 and Pdgfrb mRNA levels in isolated rHSCs from CCl4-treated rats were increased compared with those from control rats as measured using qRT-PCR (n = 3, *P < 0.05). (C) Nrp1 mRNA levels were increased in rHSCs from BDL as compared with sham-operated rats (n = 5, *P < 0.05). (D) Five-micrometer sections of rat liver were stained with an Ab against NRP-1 (green). Liver tissues of rats treated with either vehicle or CCl4 were coimmunostained for PDGFRβ and NRP-1. Representative images for NRP-1 staining (in green) are shown in the left panels and for PDGFRβ (in red), in the middle panels; overlays of the two (in yellow) are in the right panels. Below each image is the colocalization analysis for each of the overlay images. The graph peaks represent the fluorescence intensities of the staining at the given distances (in micrometers) along the straight white bar. The white bars in the overlay images represent the area selected for colocalization. (E) Time course expression of NRP-1 in liver of CCl4-treated rats. Liver tissue of rats treated with CCl4 was sectioned at various time points and coimmunostained using NRP-1 and PDGFRβ Ab. Original magnification, ×10.
Figure 2
Figure 2. NRP-1 is enriched within low-buoyant-density membrane microdomains and colocalizes with PDGFRβ.
(A) LX2 cells transduced with PDGFRβ retrovirus were cotransduced with Ad-NRP-1–RFP. Cells were immunostained with NRP-1 (red) and PDGFRβ (green) Abs and photographed under a confocal microscope. The top row shows ×20 magnification and the bottom row shows ×63 magnification of the cropped cell, with further magnification of the cropped area (representative photomicrographs or Western blot are from 3 independent experiments). (B) HSC lysates were prepared for sucrose density gradient fractionation studies, and equal volumes of each fraction were analyzed by SDS-PAGE (top). White line indicates splicing of a noncontiguous sample from the same membrane. NRP-1 was also found to be enriched within low-buoyant-density fractions as assessed by levels of NRP-1 per microgram protein within each fraction when SDS-PAGE fraction signal was normalized for protein concentration (bottom). Separation and purity of membrane fractions were determined by immunoblotting for caveolin-1, a marker for low-buoyant-density membranes (n = 3). TPM, total plasma membrane. (C) Cyclodextrin, a compound that disrupts low-buoyant-density vesicle formation, inhibits PDGF-dependent hHSC chemotaxis. Cyclodextrin inhibition of PDGF-induced HSC chemokinesis was studied using time-lapse video microscopy followed by analysis using MetaMorph Imaging software. The right 2 bars show a reversible effect of cyclodextrin, thus reducing the likelihood of cell toxicity relating to the compound (n = 3, *P < 0.05).
Figure 3
Figure 3. NRP-1 is required for PDGF-dependent HSC motility and chemotaxis.
hHSCs were transfected with NRP-1 siRNA or a scrambled siRNA. Cells were prepared for analysis of cell movement by plating in a Boyden chamber for analysis of cell chemotaxis (A) or alternatively for individual cell motility by using DIC imaging and MetaMorph software (B). (A) hHSCs transfected with NRP-1 siRNA evidenced diminished PDGF-dependent cell motility as assessed by measurement of distance traveled and also evidenced impaired chemotactic responses to PDGF (n = 4, *P < 0.05). NRP-1 protein knockdown by NRP-1 siRNA is depicted in the right-side Western blot. (B) Representative examples of migration tracks of cells transfected with Cy3-labeled NRP-1 siRNA or scrambled siRNA and tracked for 3 hours. Cell movements were recorded by time-lapse videomicroscopy and quantified by MetaMorph software. Total distance covered by the tracked cells was measured and plotted as percentage of change in response to PDGF (n = 3, *P < 0.05). (C) hHSCs were transduced with retroviral vector encoding RFP-tagged NRP-1 (NRP-1–RFP) or, alternatively, RFP alone, and NRP-1–RFP overexpression was assessed by Western blot analysis. Cells were analyzed for cell motility using a wounding assay with tracking of fluorescent signal of individual cells (n = 3, *P < 0.05). (D) Cell migration was also studied using a Boyden chamber in LX2 cells transduced with RFP alone and NRP-1–RFP retrovirus. Cells transduced with NRP-1–RFP evidenced enhanced PDGF-dependent cell movement as compared with cells transduced with RFP control. Quantification of data in terms of percent change in motility is shown (n = 3, *P < 0.05). (E) Imatinib, a pharmacologic inhibitor of PDGFRβ, blocked the enhanced migration conferred by NRP-1–RFP overexpression (n = 3, *P < 0.05).
Figure 4
Figure 4. Migration is reduced in HSCs isolated from mice with genetic deletion of NRP-1.
(A) Strategy for the deletion on NRP-1. The targeted allele Nrp1 within exon 2 (Ex-2) is flanked with loxP sites (triangles). Cre-recombinase under the control of the adenovirus CMV promoter mediates the excision of loxP-flanked exon 2. (B) Assessment of Nrp1 deletion using adenovirus Cre in HSCs; Cre-mediated excision on the lox-flanked exon 2 leads to loss of amplified PCR fragment of 200 bp. (C) The migration response to PDGF in HSCs isolated from NRP-1 floxed mice transduced with AdCre is reduced compared with cells transduced with AdGFP as measured by Boyden chamber assay (*P < 0.05 compared with AdGFP).
Figure 5
Figure 5. NRP-1 enhances cellular binding of PDGF ligand.
(A and B) PDGF was labeled with 125I and incubated with hHSCs at varying concentrations; binding curves were generated and respective dissociation constants were calculated. NRP-1–overexpressing cells showed high affinity for PDGF (B), with Kd of 193 pM compared with Kd of 606 pM in the control RFP-transfected hHSCs (A). Bmax indicates the amount of PDGF required to saturate the population of PDGF receptors present in the samples. (C) Immunoprecipitation of PDGFRβ from cell lysates incubated with 125I-labeled PDGF showed enhanced binding with NRP-1–RFP compared with control RFP (left panel). Immunoprecipitation of NRP-1–RFP from same lysates showed relatively less coprecipitation of PDGFRβ with NRP-1 (right panel).
Figure 6
Figure 6. NRP-1 enhances PDGFRβ autophosphorylation and Rac1 activity.
(A) hHSCs transduced with NRP-1–RFP or RFP alone were stimulated with PDGF-BB (10 ng/ml) for various durations of time from 0 to 180 minutes. Cell lysates were subjected to Western blot analyses with indicated Abs. NRP-1 overexpression enhanced the duration and intensity of PDGFRβ autophosphorylation at Tyr857. (B) Rac1 activity assay was performed with LX2 cells transduced with NRP-1–RFP and RFP and treated with PDGF-BB in a time series of 0, 3, 10, and 60 minutes. Rac1 activation levels are increased in LX2 cells transduced with NRP-1–RFP treated with PDGF-BB compared with HSCs transduced with RFP alone in the absence of changes in total Rac1 protein levels (representative autoradiographs or Western blots are from 3 independent experiments). (C) Rac1 inhibition blocks NRP-1–induced increase in cell migration. Ad–NRP-1 or Ad-GFP was cotransduced with a retroviral dominant negative Rac1 (Rac1DN) or LacZ in HSCs. Cell migration was analyzed in the presence of either vehicle or PDGF. The boxed Western blot shows the overexpression of Rac1DN in the experimental compared with the control group. *P < 0.05.
Figure 7
Figure 7. NRP-1 promotes Rac1 activity through c-Abl kinase activity.
(A) Rac activity assay of c-Abl/Arg–/– MEFs was performed using GST-PBD pulldown assay after administration of PDGF (10 ng/ml) at different time points (0–10 minutes). Each group was analyzed by Western blot using Rac1 Ab. c-Abl/Arg–/– MEFs displayed impaired Rac1 activity. (B) siRNA knockdown of c-Abl was examined in LX2 cells incubated with vehicle or PDGF (10 ng/ml) for 5 minutes. Rac activity assay was performed from cell lysates and revealed reduced activity in cells transfected with c-Abl siRNA. Total Rac, c-Abl, and actin blots were performed on parallel, identically loaded membranes at the same time as GST pulldowns or autoradiography. (C) NRP-1 was overexpressed in wild-type or c-Abl/Arg–/– MEFs, and Rac1 activity was measured. Rac activity was markedly diminished in c-Abl/Arg–/– MEFs despite NRP-1 overexpression. (D) LX2 cells or MEFs (wild-type, Nrp1–/–, c-Abl/Arg–/–) were assessed for c-Abl activity in the presence or absence of PDGF. PDGF stimulation increased c-Abl activity in LX2 cells (left panel), and PDGF-induced c-Abl activity was impaired in MEFs isolated from Nrp1–/– MEFs (middle panel). Overexpression of NRP-1 enhanced c-Abl activity in the presence of PDGF (right panel). (E) Association of c-Abl and NRP-1 was assessed by coimmnuoprecipitation assay using c-Abl Ab. Binding of c-Abl and NRP-1 was enhanced in LX2 cells overexpressing NRP-1 (left panel). PDGF promoted binding of c-Abl and NRP-1 (middle panel). PDGF-induced binding was not detected in MEFs isolated from c-Abl/Arg–/– or Nrp1–/– MEFs (right panel). (CE) Samples were run on the same membrane; noncontiguous lanes are denoted by white lines.
Figure 8
Figure 8. Ad NRP-1 increases the migratory and angiogenic phenotype of rHSCs from control and CCl4-treated animals.
(A) HSC migration was studied using Boyden chamber assay in the presence of 1 of 2 NRP-1–neutralizing Abs that bind to Sema-3A– (NRP-1a) or VEGF-binding (NRP-1b) domains of NRP-1, respectively. PDGF-induced HSC migration was more prominently affected by NRP-1b Ab than NRP-1a Ab (n = 3, *P < 0.05). (B) Effect of NRP-1 Ab on PDGF-induced isolated rHSC migration using Boyden chamber was studied. NRP-1b Ab reduced PDGF-induced cell migration in rHSCs, nearly normalizing the enhanced motility observed in rHSCs isolated from CCl4-treated rats (n = 3, *P < 0.05). (C) NRP-1b Ab reduced the PDGF-induced tube formation ability of rHSCs isolated from rats treated with vehicle and/or CCl4 and corrected the enhanced tube formation capacity of HSCs isolated from rats receiving CCl4 (n = 3, *P < 0.05).
Figure 9
Figure 9. NRP-1 regulates PDGFRβ-dependent HSC functions in rodent cirrhosis in vivo.
(A) Liver tissues of mice administered vehicle (n = 5), CCl4 (n = 8) or CCl4 in combination with i.p. injection of NRP-1b Ab (n = 8) were fixed and coimmunostained for PDGFRβ and NRP-1. Representative images for each staining show NRP-1 (green), PDGFRβ (red), and an overlay of the two (yellow). Liver sections of mice treated with vehicle, CCl4, and CCl4 with NRP-1 Ab were also stained with Sirius red to depict the fibrotic strands in red correlating with degree of fibrosis. Original magnification, ×10. (B) Hydroxyproline content was analyzed for the collagen estimation in liver of CCl4-treated mice. Hydroxyproline levels were significantly reduced in mice treated with CCl4 and NRP-1 Ab as compared with CCl4 alone (n = 5–8, *P < 0.05). Pdgfrb and Nrp1 levels were quantified using qRT-PCR. The results from frozen tissue sections in each group showed that respective mRNA levels were significantly reduced in mice treated with CCl4 and NRP-1 Ab compared with CCl4 alone (n = 5–8, *P < 0.05). (C) Collagen1αI, α-SMA, Tgfb, Ctgf, vimentin, Mmp3, and Timp1 mRNA levels were quantified using qRT-PCR from the frozen tissue sections in each group. Results showed that collagen1αI, α-SMA, Tgfb, Ctgf, and Mmp3 mRNA levels were significantly reduced in mice treated with CCl4 and NRP-1 Ab compared with CCl4 alone (n = 5–8, *P < 0.05). Timp1 mRNA levels remained unchanged in CCl4-treated groups irrespective of NRP-1 Ab treatment.
Figure 10
Figure 10. NRP-1 promotes PDGF-BB–induced collagen secretion in LX2 cells.
LX2 cells or MEFs (wild-type or c-Abl/Arg–/–) transduced with NRP-1–RFP or RFP alone were stimulated with PDGF-BB (10 ng/ml) for various durations of time from 0 to 48 hours after overnight serum starvation. (A) Media from cultured cells was collected, concentrated, and subjected to Western blot analysis for collagen I. NRP-1 overexpression promoted increased basal as well as PDGF-BB–induced collagen expression in LX2 cells (n = 3, with depiction of a representative radiograph). Membranes were stained with 0.5% Ponceau S, to assure equal protein loading (data not shown). (B) Total collagen content in the cell culture media was quantified using Sircol collagen assay. NRP-1 overexpression promoted basal as well as PDGF-BB–induced collagen secretion in LX2 cells (n = 3, *P < 0.05). (C) Collagen I secretion was markedly reduced in c-Abl/Arg–/– compared with wild-type MEFs in the presence and absence or NRP-1 overexpression.
Figure 11
Figure 11. NRP-1 promotes TGF-β–induced collagen secretion in LX2 cells and MEFs.
LX2 cells and MEFs (wild-type, c-Abl/Arg–/–, and Nrp1–/–) transduced with NRP-1 or RFP or GFP alone were stimulated with TGF-β (10 ng/ml) for various durations of time from 0 to 48 hours after overnight serum starvation. (A) Media from cultured cells was collected, concentrated, and subjected to Western blot analysis for collagen I. NRP-1 overexpression increased basal as well as TGF-β–induced collagen expression in LX2 cells (n = 3, with depiction of a representative radiograph). (B) Total collagen content in the cell culture media was quantified using Sircol collagen assay. NRP-1 overexpression promoted basal as well as TGF-β–induced collagen secretion in LX2 cells (n = 3, *P < 0.05). (C) Media from cultured cells was collected and subjected to Western blot analysis for collagen I. NRP-1 overexpression promoted TGF-β–induced collagen secretion in MEFs, and deletion of c-Abl and Nrp1 abrogated this effect.
Figure 12
Figure 12. Increased NRP-1 expression in human cirrhotic specimens.
(A) NRP-1 and PDGFRβ protein levels were increased in human cirrhotic liver (HCV) samples as assessed by Western blot analysis. Note the prominent increase in the higher-molecular-weight glycosylated form of NRP-1. The ratio of glycosylated/native (Glyco/native) NRP-1 and PDGFRβ/β-actin was increased in cirrhotic liver (HCV) samples compared with normal human liver samples. Samples were run on the same membrane; noncontiguous lanes are denoted by white lines. (B) NRP-1 and PDGFRβ protein levels were increased in correspondence with the stage of cirrhosis of human NASH liver samples. A similar increase in ratio of glycosylated/native NRP-1 and PDGFRβ/β-actin was observed with increasing stages of NASH samples (representative Western blots are from 3 independent experiments). (C) Nrp1 and Pdgfrb mRNA levels were analyzed and compared in stage 0–4 human NASH liver samples. mRNA levels of both molecules were increased in human cirrhotic liver samples as assessed by qRT-PCR.
Figure 13
Figure 13. Mechanistic role of NRP-1 in liver fibrosis.
A proposed model depicting the role of NRP-1 in liver fibrosis. NRP-1 increases PDGF ligand binding with PDGFR, thereby amplifying PDGFR phosphorylation. NRP-1 glycosylation chains are postulated to contribute to this process. NRP-1 also directs PDGFR signals toward Rac1 through its ability to bind and activate c-Abl, a protein that promotes Rac1 function. The intracellular SEA domain of NRP-1 may mediate this effect. NRP-1 also regulates other growth factors important for liver fibrosis including TGF-β and VEGF receptors in ECs (latter not shown). Increases in NRP-1 correspond with liver fibrosis progression and support this molecule as a potential therapeutic target for liver fibrosis treatment.

Comment in

Similar articles

Cited by

References

    1. Schuppan D, Afdhal NH. Liver cirrhosis. Lancet. 2008;371(9615):838–851. doi: 10.1016/S0140-6736(08)60383-9. - DOI - PMC - PubMed
    1. Shah VH, Kamath PS. Portal hypertension and gastrointestinal bleeding. In Feldman M, Friedman LS, Brandt LJ, eds.Sleisenger and Fordtran’s Gastrointestinal and Liver Disease . 8th ed. Philadelphia, Pennsylvania, USA: Elsevier Health Sciences; 2006:1899–1934.
    1. Friedman SL. Mechanisms of hepatic fibrogenesis. Gastroenterology. 2008;134(6):1655–1669. doi: 10.1053/j.gastro.2008.03.003. - DOI - PMC - PubMed
    1. Rockey DC. Current and future anti-fibrotic therapies for chronic liver disease. Clin Liver Dis. 2008;12(4):939–962. - PMC - PubMed
    1. Jain R, Booth M. What brings pericytes to tumor vessels? J Clin Invest. 2003;112(8):1134–1136. - PMC - PubMed

Publication types

MeSH terms

Substances