. 2010 Jul;120(7):2355-69.
doi: 10.1172/JCI40671. Epub 2010 Jun 23.

Metformin inhibits hepatic gluconeogenesis in mice independently of the LKB1/AMPK pathway via a decrease in hepatic energy state

Affiliations

Metformin inhibits hepatic gluconeogenesis in mice independently of the LKB1/AMPK pathway via a decrease in hepatic energy state

Marc Foretz et al. J Clin Invest. 2010 Jul.

Abstract

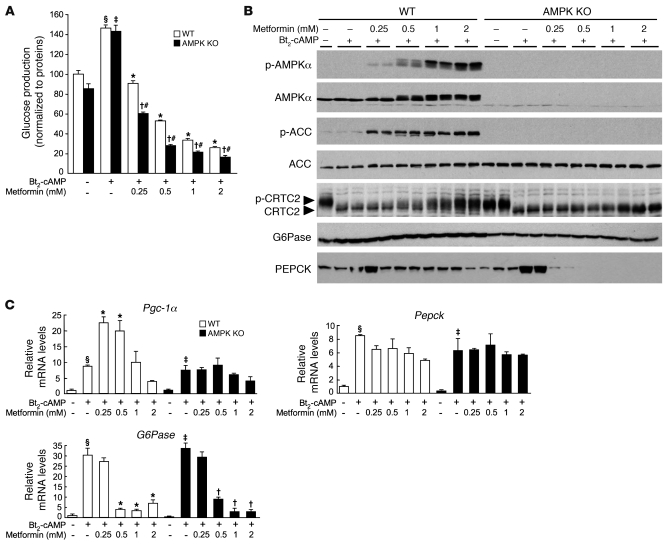
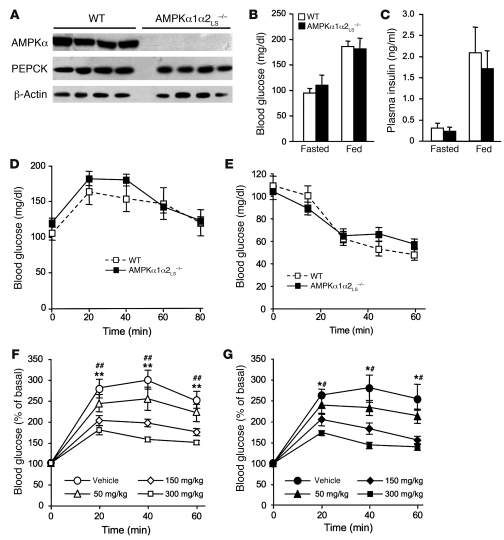
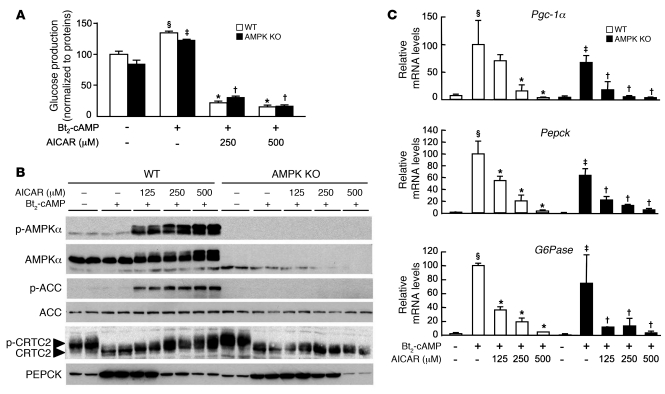
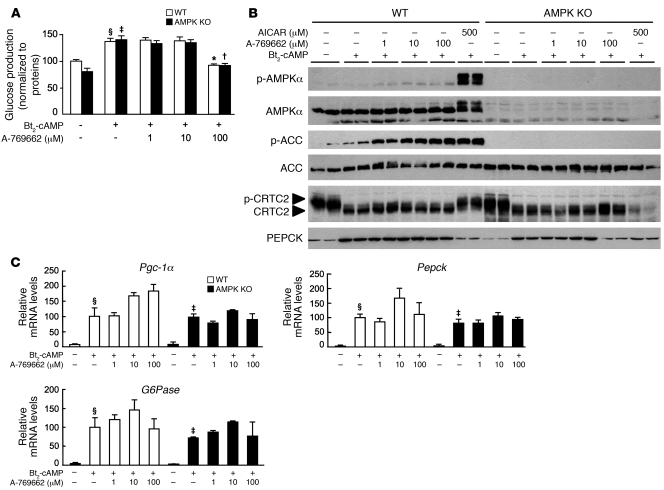
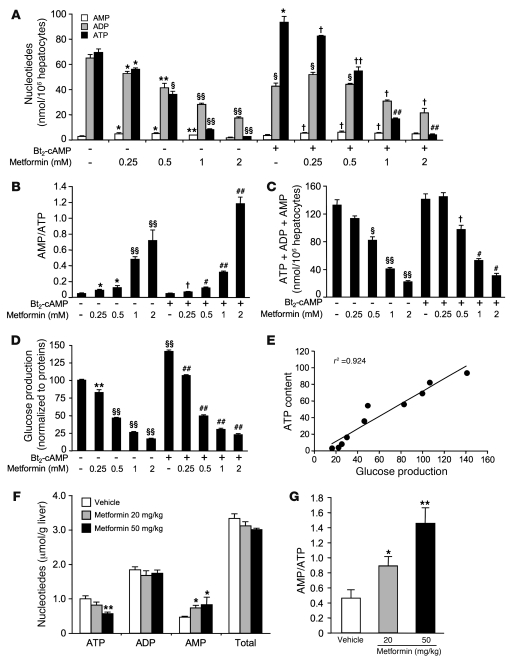
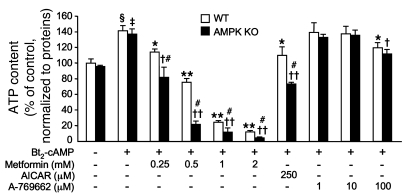
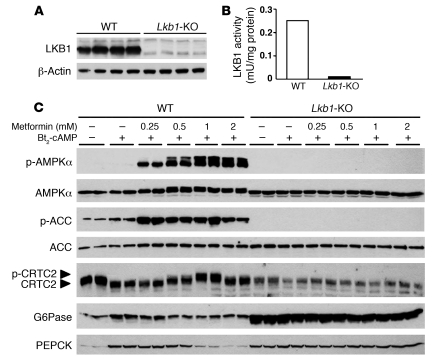
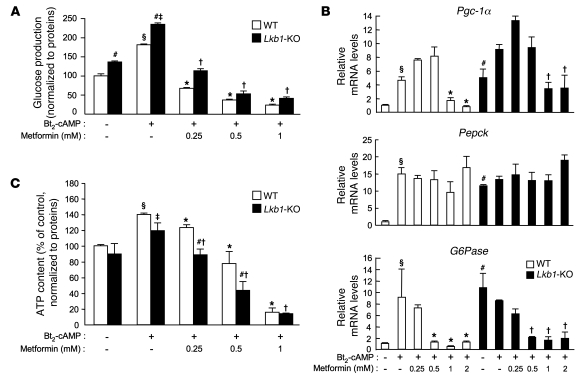
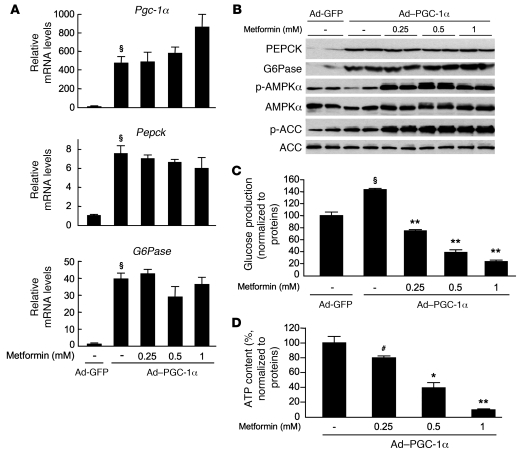
Metformin is widely used to treat hyperglycemia in individuals with type 2 diabetes. Recently the LKB1/AMP-activated protein kinase (LKB1/AMPK) pathway was proposed to mediate the action of metformin on hepatic gluconeogenesis. However, the molecular mechanism by which this pathway operates had remained elusive. Surprisingly, here we have found that in mice lacking AMPK in the liver, blood glucose levels were comparable to those in wild-type mice, and the hypoglycemic effect of metformin was maintained. Hepatocytes lacking AMPK displayed normal glucose production and gluconeogenic gene expression compared with wild-type hepatocytes. In contrast, gluconeogenesis was upregulated in LKB1-deficient hepatocytes. Metformin decreased expression of the gene encoding the catalytic subunit of glucose-6-phosphatase (G6Pase), while cytosolic phosphoenolpyruvate carboxykinase (Pepck) gene expression was unaffected in wild-type, AMPK-deficient, and LKB1-deficient hepatocytes. Surprisingly, metformin-induced inhibition of glucose production was amplified in both AMPK- and LKB1-deficient compared with wild-type hepatocytes. This inhibition correlated in a dose-dependent manner with a reduction in intracellular ATP content, which is crucial for glucose production. Moreover, metformin-induced inhibition of glucose production was preserved under forced expression of gluconeogenic genes through PPARgamma coactivator 1alpha (PGC-1alpha) overexpression, indicating that metformin suppresses gluconeogenesis via a transcription-independent process. In conclusion, we demonstrate that metformin inhibits hepatic gluconeogenesis in an LKB1- and AMPK-independent manner via a decrease in hepatic energy state.


Figures

Figure 1
Figure 1. Metformin inhibits gluconeogenesis in AMPKα1α2-null (AMPK KO) mouse hepatocytes.
After attachment, WT and AMPK-deficient primary hepatocytes were cultured for 16 hours in M199 medium containing 100 nM dex. Hepatocytes were then incubated in glucose-free DMEM containing lactate/pyruvate (10:1 mM) and 100 nM dex alone or with 100 μM Bt2-cAMP and with or without 0.25, 0.5, 1, or 2 mM metformin. After 8 hours, medium was collected for glucose measurement and cells were harvested for Western blot and gluconeogenic gene expression analyses. (A) Glucose production was normalized to protein content and presented as a percentage of glucose produced by WT hepatocytes incubated in the absence of both Bt2-cAMP and metformin. Results are representative of 5 independent experiments. (B) Immunoblots were performed against phospho-AMPKα (Thr172), AMPKα, phospho-ACC (Ser79), ACC, CRTC2, G6Pase, and PEPCK. Blots are representative of at least 5 independent experiments. (C) Relative mRNA levels of Pgc-1α, Pepck, and G6Pase expressed as fold activation relative to levels in WT hepatocytes incubated in the absence of both Bt2-cAMP and metformin. Results are representative of 5 independent experiments. Data are mean ± SEM. §P < 0.001, P < 0.001 compared with WT and AMPK-KO hepatocytes incubated without Bt2-cAMP; *P < 0.001, P < 0.001 compared with WT and AMPK-KO hepatocytes incubated with Bt2-cAMP alone; #P < 0.01 compared with WT hepatocytes incubated under the same conditions.
Figure 2
Figure 2. Effects of metformin on blood glucose levels in AMPKα1α2LS–/– mice.
(A) Western blot analysis of AMPKα and PEPCK proteins in livers from 24-hour-fasted control and AMPKα1α2LS–/– mice. β-Actin was immunoblotted as a loading control. Each lane represents the liver sample from an individual mouse. (B) Plasma blood glucose levels were measured in fasted and fed control and AMPKα1α2LS–/– mice. n = 5–6. (C) Plasma insulin levels were measured in fasted and fed control and AMPKα1α2LS–/– mice. Data are mean ± SEM (n = 5–6). (D) Pyruvate tolerance tests (2 g/kg) in control and AMPKα1α2LS–/– mice were used to assess hepatic gluconeogenesis. n = 6–7. (E) Insulin tolerance tests (0.25 U/kg) in control and AMPKα1α2LS–/– mice. n = 6–9. Metformin tolerance tests in control (F) and AMPKα1α2LS–/– (G) mice. Mice were given an oral gavage dose of 50, 150, or 300 mg/kg metformin or vehicle and after 30 minutes challenged with an oral administration of glucose (3 g/kg body weight). n = 6–10. Data are mean ± SEM. *P < 0.05, **P < 0.005, 150 mg/kg metformin compared with vehicle control; #P < 0.01, ##P < 0.001, 300 mg/kg compared with the vehicle control.
Figure 3
Figure 3. Effects of AICAR on gluconeogenesis in WT and AMPK-KO hepatocytes.
After attachment, WT and AMPK-deficient primary hepatocytes were cultured for 16 hours in M199 medium containing 100 nM dex. Hepatocytes were then incubated in glucose-free DMEM containing lactate/pyruvate (10:1 mM) and 100 nM dex, alone or with 100 μM Bt2-cAMP and with or without 125, 250, or 500 μM AICAR. After 8 hours, medium was collected for glucose measurement, and cells were harvested for Western blot and gluconeogenic gene expression analyses. (A) Glucose production was normalized to protein content and expressed as a percentage of glucose production by WT hepatocytes incubated in the absence of both Bt2-cAMP and AICAR. Results are representative of 5 independent experiments. (B) Immunoblots were performed against phospho-AMPKα (Thr172), AMPKα, phospho-ACC (Ser79), ACC, CRTC2, and PEPCK. Blots are representative of at least 3 independent experiments. (C) Relative mRNA levels of Pgc-1α, Pepck, and G6Pase expressed as a percentage of WT hepatocytes incubated in the absence of both Bt2-cAMP and AICAR. Results are representative of 5 independent experiments. Data are mean ± SEM. §P < 0.01, P < 0.01 compared with WT and AMPK-KO hepatocytes incubated without Bt2-cAMP; *P < 0.01, P < 0.01 compared with WT and AMPK-KO hepatocytes incubated with Bt2-cAMP alone.
Figure 4
Figure 4. Effects of A-769662 on gluconeogenesis in WT and AMPK-KO hepatocytes.
After attachment, WT and AMPK-deficient primary hepatocytes were cultured for 16 hours in M199 medium containing 100 nM dex. Hepatocytes were then incubated in glucose-free DMEM containing lactate/pyruvate (10:1 mM) and 100 nM dex alone or with 100 μM Bt2-cAMP and with or without 1, 10, or 100 μM A-769662. After 8 hours, medium was collected for glucose measurement and cells were harvested for Western blot and gluconeogenic gene expression analyses. (A) Glucose production was normalized to protein content and expressed as a percentage of glucose production by WT hepatocytes incubated in the absence of both Bt2-cAMP and A-769662. Results are representative of 5 independent experiments. (B) Immunoblots were performed against phospho-AMPKα (Thr172), AMPKα, phospho-ACC (Ser79), ACC, CRTC2, and PEPCK. Blots are representative of least 5 independent experiments. (C) Relative mRNA levels of Pgc-1α, Pepck, and G6Pase expressed as fold activation relative to levels in WT hepatocytes incubated in the absence of both Bt2-cAMP and A-769662. Results are representative of 5 independent experiments. Data are mean ± SEM. §P < 0.01, P < 0.01 compared with WT and AMPK-KO hepatocytes incubated without Bt2-cAMP; *P < 0.01, P < 0.01 compared with WT and AMPK-KO hepatocytes incubated with Bt2-cAMP alone.
Figure 5
Figure 5. Metformin reduces energy state in primary hepatocytes and in liver of C57BL/6J mice.
(AE) After attachment, C57BL/6J mouse primary hepatocytes were cultured for 16 hours in M199 medium containing 100 nM dex. Hepatocytes were then incubated in glucose-free DMEM containing lactate/pyruvate (10:1 mM) and 100 nM dex alone or with 100 μM Bt2-cAMP and with or without 0.25, 0.5, 1, or 2 mM metformin. After 8 hours, medium was collected for glucose measurement and cells were harvested for measurement of adenine nucleotide content. (A) ATP, ADP, and AMP content in hepatocytes, (B) AMP/ATP ratios, and (C) total adenine nucleotide content are shown for each condition. (D) Glucose production was normalized to protein content and presented as a percentage of glucose produced by hepatocytes incubated in the absence of both Bt2-cAMP and metformin. (E) Correlation between glucose production and ATP content shown in D and A, respectively. Results are representative of 3 independent experiments. *P < 0.05, **P < 0.01, §P < 0.005, §§P < 0.001 compared with hepatocytes incubated in the absence of both Bt2-cAMP and metformin; P < 0.05, ††P < 0.01, #P < 0.005, ##P < 0.001 compared with hepatocytes incubated with Bt2-cAMP alone. (F and G) Ten-week-old C57BL/6J male mice (n = 7 per group) were treated orally with 20 or 50 mg/kg metformin in water or with water alone for 5 consecutive days. On the fifth day, mice were fasted for 24 hours and liver was collected 1 hour after metformin administration for hepatic ATP, ADP, and AMP determination. (F) Total adenine nucleotide content and (G) AMP/ATP ratios are shown for each condition. *P < 0.05, **P < 0.005 compared with vehicle. Data are mean ± SEM.
Figure 6
Figure 6. Effects of AMPK activators on intracellular ATP content in WT and AMPK-KO hepatocytes.
After attachment, WT and AMPK-deficient primary hepatocytes were cultured for 16 hours in M199 medium containing 100 nM dex. Hepatocytes were then incubated in glucose-free DMEM containing lactate/pyruvate (10:1 mM) and 100 nM dex alone or with 100 μM Bt2-cAMP and with or without various concentrations of metformin, AICAR, or A-769662 as indicated. After 8 hours, cells were harvested for ATP content measurement. Results are representative of 6 independent experiments. Data are mean ± SEM. §P < 0.001, P < 0.001 compared with WT and AMPK-KO hepatocytes incubated without Bt2-cAMP; *P < 0.05, **P < 0.001 compared with WT hepatocytes incubated with Bt2-cAMP alone; P < 0.01, ††P < 0.001 compared with AMPK-KO hepatocytes incubated with Bt2-cAMP alone; #P < 0.01 compared with WT hepatocytes incubated under the same conditions.
Figure 7
Figure 7. Effects of metformin on AMPK activation in WT and Lkb1-KO hepatocytes.
After attachment, WT and LKB1-deficient primary hepatocytes were cultured for 16 hours in M199 medium containing 100 nM dex. Hepatocytes were then incubated in glucose-free DMEM containing lactate/pyruvate (10:1 mM) and 100 nM dex alone or with 100 μM Bt2-cAMP and with or without 0.25, 0.5, 1, or 2 mM metformin. After 8 hours, cells were harvested for Western blot analysis and measurement of LKB1 activity. (A) The level of LKB1 protein was assessed by immunoblot analysis using anti-LKB1 antibodies. β-Actin was immunoblotted as a loading control. (B) LKB1 activity was assessed following its immunoprecipitation and assayed with the LKBtide peptide. Assays were performed on hepatocyte extracts from 3 independent experiments. (C) Immunoblots were performed against phospho-AMPKα (Thr172), AMPKα, phospho-ACC (Ser79), ACC, CRTC2, G6Pase, and PEPCK. Blots are representative of 3 independent experiments.
Figure 8
Figure 8. Metformin inhibits gluconeogenesis in LKB1-deficient mouse hepatocytes.
After attachment, WT and LKB1-deficient primary hepatocytes were cultured for 16 hours in M199 medium containing 100 nM dex. Hepatocytes were then incubated in glucose-free DMEM containing lactate/pyruvate (10:1 mM) and 100 nM dex alone or with 100 μM Bt2-cAMP and with or without 0.25, 0.5, 1, or 2 mM metformin. After 8 hours, medium was collected for glucose measurement and cells were harvested for ATP content assessment and gluconeogenic gene expression analysis. (A) Glucose production was normalized to protein content and expressed as a percentage of glucose produced by WT hepatocytes incubated in the absence of both Bt2-cAMP and metformin. Results are representative of 3 independent experiments. (B) Relative mRNA levels of Pgc-1α, Pepck, and G6Pase expressed as fold activation relative to levels in WT hepatocytes incubated in the absence of both Bt2-cAMP and metformin. Results are representative of 3 independent experiments. (C) ATP intracellular content normalized to protein content and expressed as a percentage of WT hepatocyte ATP content incubated in the absence of both Bt2-cAMP and metformin. Results are representative of 4 independent experiments. Data are mean ± SEM. §P < 0.01, P < 0.01 compared with WT and AMPK-KO hepatocytes incubated without Bt2-cAMP; *P < 0.01, P < 0.01 compared with WT and Lkb1-KO hepatocytes incubated with Bt2-cAMP alone; #P < 0.05 compared with WT hepatocytes incubated under the same conditions.
Figure 9
Figure 9. Forced expression of gluconeogenic genes does not prevent the metformin-induced inhibition of hepatic glucose production.
After attachment, WT primary hepatocytes were infected with 25 PFU/cell of Ad-GFP or Ad–PGC-1α adenovirus and cultured for 16 hours in M199 medium containing 100 nM dex. Hepatocytes were then incubated in glucose-free DMEM containing lactate/pyruvate (10:1 mM) and 100 nM dex alone or with 0.25, 0.5, or 1 mM metformin. After 8 hours, medium was collected for glucose measurement and cells were harvested for Western blot and gluconeogenic gene expression analyses and ATP content determination. (A) Relative mRNA levels of Pgc-1α, Pepck, and G6Pase expressed as fold activation relative to levels in Ad-GFP–infected hepatocytes. Results represent 3 independent experiments. §P < 0.001 compared with Ad-GFP–infected hepatocytes. (B) Immunoblots were performed against PEPCK, G6Pase, phospho-AMPKα (Thr172), AMPKα, phospho-ACC (Ser79), and ACC. Blots represent of 3 independent experiments. (C) Glucose production and (D) ATP intracellular content were normalized to protein content and expressed as a percentage of that produced by Ad-GFP– or Ad-PGC-1α–infected hepatocytes incubated in the absence of metformin. Results represent 5 independent experiments. §P < 0.01 compared with Ad-GFP–infected hepatocytes; #P < 0.05, *P < 0.01, **P < 0.001 compared with Ad–PGC-1α–infected hepatocytes incubated in the absence of metformin. Data are mean ± SEM.

Comment in

Similar articles

Cited by

References

    1. Rotella CM, Monami M, Mannucci E. Metformin beyond diabetes: new life for an old drug. Curr Diabetes Rev. 2006;2(3):307–315. doi: 10.2174/157339906777950651. - DOI - PubMed
    1. Crandall JP, et al. The prevention of type 2 diabetes. Nat Clin Pract Endocrinol Metab. 2008;4(7):382–393. doi: 10.1038/ncpendmet0843. - DOI - PMC - PubMed
    1. Klip A, Leiter LA. Cellular mechanism of action of metformin. Diabetes Care. 1990;13(6):696–704. doi: 10.2337/diacare.13.6.696. - DOI - PubMed
    1. Bailey CJ, Turner RC. Metformin. N Engl J Med. 1996;334(9):574–579. doi: 10.1056/NEJM199602293340906. - DOI - PubMed
    1. Kirpichnikov D, McFarlane SI, Sowers JR. Metformin: an update. Ann Intern Med. 2002;137(1):25–33. doi: 10.1001/archinte.137.1.25. - DOI - PubMed

Publication types

MeSH terms