. 2010 May 28:4:14.
doi: 10.3389/fncel.2010.00014. eCollection 2010.

High-Pass Filtering and Dynamic Gain Regulation Enhance Vertical Bursts Transmission along the Mossy Fiber Pathway of Cerebellum

Affiliations

High-Pass Filtering and Dynamic Gain Regulation Enhance Vertical Bursts Transmission along the Mossy Fiber Pathway of Cerebellum

Jonathan Mapelli et al. Front Cell Neurosci. .

Abstract

Signal elaboration in the cerebellum mossy fiber input pathway presents controversial aspects, especially concerning gain regulation and the spot-like (rather than beam-like) appearance of granular to molecular layer transmission. By using voltage-sensitive dye imaging in rat cerebellar slices (Mapelli et al., 2010), we found that mossy fiber bursts optimally excited the granular layer above approximately 50 Hz and the overlaying molecular layer above approximately 100 Hz, thus generating a cascade of high-pass filters. NMDA receptors enhanced transmission in the granular, while GABA-A receptors depressed transmission in both the granular and molecular layer. Burst transmission gain was controlled through a dynamic frequency-dependent involvement of these receptors. Moreover, while high-frequency transmission was enhanced along vertical lines connecting the granular to molecular layer, no high-frequency enhancement was observed along the parallel fiber axis in the molecular layer. This was probably due to the stronger effect of Purkinje cell GABA-A receptor-mediated inhibition occurring along the parallel fibers than along the granule cell axon ascending branch. The consequent amplification of burst responses along vertical transmission lines could explain the spot-like activation of Purkinje cells observed following punctuate stimulation in vivo.

Keywords: GABA-A receptors; NMDA receptors; cerebellum; gain control; imaging; voltage-sensitive dye.


Figures

Figure 1
Figure 1
Mossy fiber and climbing fiber responses to white matter stimulation. VSD imaging in parasagittal slices of the cerebellar vermis. In this and in the following figures: mf, mossy fiber; GL, granular layer; PC, Purkinje cell layer, ML, molecular layer, pf, parallel fiber. In this and the following figures, yellow dots indicate stimulation electrodes. (A) Optical maps of responses evoked by a single stimulus delivered to the white matter (arrowhead), illustrating the sequence of granular to molecular layer activation through the mossy fibers. Maps show the temporal evolution of granular and molecular layer activation with a time resolution of 1 ms. In the granular layer, the optical signal rapidly propagates from the stimulation site with short delay (2–3 ms) and peaks in 5–6 ms. The activity propagates in a restricted region of the molecular layer (rectangle) with a further delay of 3 ms compared to the corresponding granular layer activation (circle). The traces illustrate the time course of granular layer (black trace) and molecular layer (grey trace) activation following white matter stimulation in the same ROIs indicated on the left. Molecular layer activation is slower and smaller than granular layer activation (magnified in the inset). The schematics on the right illustrate the orientation of mossy fibers branching. (B) Optical maps of responses evoked by a single stimulus delivered to the white matter, illustrating direct Purkinje cell activation through the climbing fibers. An intense molecular layer response peaks in 3–5 ms anticipating a slower granular layer response peaking in 7–8 ms. The traces illustrate the time course of granular layer (black trace) and molecular layer (grey trace) activation following white matter stimulation in the same ROIs indicated on the left. Molecular layer activation is faster and larger than granular layer activation (magnified in the inset). The response time relative to stimulation is are indicated for each map.
Figure 2
Figure 2
The relationship between VSD signals and Purkinje cell activity. (A) Image of a stained cerebellar slice obtained by collecting background epifluorescence showing Granular layer, Purkinje cell layer and Molecular layer during a whole-cell recording from a Purkinje cell. The patch pipette appears as a shadow (since is not filled with dye molecules). Red and orange circles indicate the ROIs corresponding to the recorded PC and its dendritic arborization, from which the VSD signals were measured. Excitatory postsynaptic potential (EPSPs) and EPSP-spike complexes were obtained at low and high stimulation intensity, respectively (arrows indicate the stimulus time). Average electrical signals (black traces) are compared with average fluorescence changes from the PC layer (red and dark blue) and from molecular layer (orange and light blue). (B) Correlation between average membrane depolarization and average fluorescence change from ROIs in the Purkinje cell layer and in the molecular layer. The intensity of fluorescence changes is normalized to the corresponding granular layer response. The dotted lines correspond to fittings performed with an exponential function, y = y0 + A1[1-exp(−x/τ)] (y0 = 0, A1 = 0.9, τ = 22.6 for Purkinje cell layer; y0 = 0, A1 = 0.6, τ = 18.7 for molecular layer). Red and orange circles indicate Purkinje cells responding with spikes to at least half of the stimuli. Data points are taken from five different cells.
Figure 3
Figure 3
GABA-A and NMDA receptor-dependent regulation of transmission along the mossy fiber pathway. (A) The effect of the GABA-A receptor blocker 10-μM gabazine in response to a single pulse in the white matter. Gabazine enhanced the granular layer response and facilitated transmission toward the molecular layer. The traces show the time course of the effect both in the granular and molecular layer. (B) The effect of the NMDA receptor blocker 50-μM APV in response to a single pulse in the white matter. APV reduced the granular layer response and markedly depressed transmission toward the molecular layer. The traces show the time course of the effect both in the granular and molecular layer.
Figure 4
Figure 4
Frequency-dependence of responses to repetitive stimulation. (A) Optical maps were obtained at the peak of responses in 5-pulse bursts delivered to the white matter for two significant frequencies (10 and 200 Hz). Passing from 10 Hz to 200 Hz, there is a progressive intensification of temporal summation in the granular layer which lead to a progressive activation of new recruited areas (white circles). Moreover, the increased stimulation frequency progressively activated the molecular layer (white rectangle) at each pulse of the burst. The post-burst maps were taken 50 ms after the end of the burst where with low-frequency stimulation the activity is almost abolished while, with high frequency there is a persistent signals throughout the granular layer. (B) Traces on the right illustrate the time course of the response in ROIs located in adjacent responding regions of the granular (black) and molecular layer (gray). Note the much stronger molecular layer response at higher frequencies and the consistent temporal summation of all signals. (C) Maximum response amplitudes were measured for each of the five pulses of bursts delivered at different frequencies in the granular (black; n = 8 slices, n = 32 ROIs for each frequency) and in the molecular layer (gray; n = 8 slices, n = 28 ROIs for each frequency). Points are reported as mean ± SEM. (D) Gain and lag curves for granular (black; n = 8 slices, n = 32 ROIs for each frequency) and molecular layer (gray; n = 8 slices, n = 28 ROIs for each frequency) responses. Gain is the maximum response obtained at a certain frequency and lag is the number of pulses needed to achieve the maximal response. The gain curves were fitted a sigmoidal function (Eq.1). Points are reported as mean ± SEM.
Figure 5
Figure 5
Regulation of frequency-dependence by GABA-A receptors. (A) Optical maps were obtained at the peak of responses in 5-pulse 100 Hz bursts delivered to the white matter. Application of 10-μM gabazine markedly enhanced amplitude and extension of responses in the granular and molecular layer, and the effect increased during and after the burst (50 ms after the end of the burst). It should be noted the marked response summation in the presence of gabazine. The enlarged map evidences the activation of the molecular layer (white arrow) following the application of 10-μM gabazine. (B) Maximum response amplitudes were measured for each of the five pulses of bursts delivered at different frequencies both in the granular and molecular layer (n = 4 slices, n = 16 ROIs for each frequency). Gain and lag curves for granular (black) and molecular layer (gray) responses show that gain increased and the shape of curves changed compared to control (dashed lines). The gain curves were fitted with a sigmoidal function (Eq.1). Lag remained over control values (dashed lines) at all frequencies. (C) The time course peak amplitude increase at 500 Hz, was taken to demonstrate for a representative frequency (the maximum tested) the non-saturating nature of the response in the presence of 10-μM gabazine (cfr Figure 4C). Points are reported as mean ± SEM.
Figure 6
Figure 6
Regulation of frequency-dependence by NMDA receptors. (A) Optical maps were obtained at the peak of responses in five-pulse 200 Hz bursts delivered to the white matter. Application of 50-μM APV markedly reduced amplitude and extension of responses in the granular and molecular layer, and the response remained stationary during the bursts. After the end of the burst (50 ms) APV reduced the remaining part of the response which was probably generated by the summation of NMDA dependent currents. The enlarged map evidences the molecular layer region (white arrow) which was activated in control condition. (B) Maximum response amplitudes were measured for each of the five pulses of bursts delivered at different frequencies both in the granular and molecular layer (n = 4 slices, n = 16 ROIs for each frequency). Gain and lag curves for granular (black) and molecular layer (gray) responses show that gain decreased and the shape of the curve changed compared to control (dashed lines). The gain curves were fitted with a sigmoidal function (Eq.1). Lag remained around control values (dashed lines) at all frequencies. (C) The time course peak amplitude increase at 500 Hz, was taken to demonstrate for a representative frequency the saturating nature of the response in the presence of 50-μM APV (cfr Figure 4C). Points are reported as mean ± SEM.
Figure 7
Figure 7
Granular and molecular layer activation in coronal slices. (A) Optical maps obtained at the peak of responses in five pulses 100 Hz burst delivered to the white matter (yellow line surrounds the stimulation electrode), in coronal slices. The molecular layer signal propagates beyond the corresponding granular layer activated area, activating distal areas of the molecular layer The traces illustrate the time course of different regions (black and gray circles) of the granular (black trace) and molecular layer (grey trace). Note that the molecular layer response proximal to the core of the granular layer activation is slower and smaller than the corresponding granular layer response, while in distal regions the molecular layer signal overcomes the almost absent granular layer response (as evidenced from the optical map). (B) The spatial profile of gain was measured for different frequencies burst both in the granular and in the molecular layer (n = 4 slices, for each frequency). 3D maps show the spatial distribution of gain functions in different experimental conditions (Control, Gabazine and APV), evidencing the space (x) and frequency (y) dependence of granular and molecular layer activation (z). Dashed lines indicate gain functions in the core of the granular and molecular layer activation (cfr Figures 4–6). The spatial profile (x-axis) of the granular layer activation is narrow around the stimulating electrode (0 reference) and decays in distal regions, maintaining this profile even increasing the stimulation frequency. Conversely the excitation profile of the molecular layer shows the activation of the periphery for all tested frequency, while the core of excitation shows a strong dependence on the stimulation frequency. The application of Gabazine enhances the granular layer excitation without significantly affecting its spatial profile and gain curve. Differently, the molecular layer excitation shows a homogeneous increase of the activation above 50 Hz. Moreover the most evident effect of the block of GABAergic synapses was to enlarge the spatial profile so that there is a massive spread of activation in distal regions (black arrow) most probably generated by to the block of the molecular layer interneurons inhibition. The application of APV decreases the excitation of both granular and molecular layer without significantly affecting its spatial profile. Nevertheless the granular layer response increases above 100–200 Hz, thus disabling the signal transmission to the molecular layer. 3D Maps were generated by using average spatial profiles with SEM values ranging from 0.0001 to 0.001 ΔF/F0. (C) The contribution of parallel fibers activation to molecular layer responses could be isolated by evaluating the spatial profile of the ratio between the molecular and granular layer gain values for different frequencies and in different experimental conditions. In control condition the gain ratio in the core of activation is similar to the case of sagittal slices (∼ 0.5). In the periphery the molecular layer overcomes the granular layer gain suggesting the signal propagation through the parallel fibers (cfr B). Dashed lines indicate the limit cases of maximum (parable) and no contribution (straight line) of parallel fiber to the molecular layer activity. The application of 10-μM gabazine increases the gain ratio spatial profiles for all frequencies. Conversely the block of NMDA receptor by the application of 50-μM APV poorly modulates the gain ratio profiles.
Figure 8
Figure 8
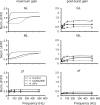
The cascade of filters from mossy to parallel fibers. Plots summarize the cascade filters generated from the mossy fiber to the parallel fibers. Signals conveyed through mossy fibers are primarily high-pass filtered by the granular layer. This first high-pass filter cuts signals below 50 Hz mainly through the activation of NMDA currents, in fact the application of APV (empty squares and dotted lines) shifts the cut-off frequencies of both gain and post-burst curves above 100 Hz. Moreover granule cell axons convey signals at the first Purkinje cells synaptic stage. Here a second filter cuts very high-frequency signals (100–200 Hz) mainly through the action of the inhibitory system. Note that gain and post-burst curves are poorly modified by the application of APV while the application of Gabazine (empty circles and dashed lines) significantly enhances gain and post-burst values decreasing the cut-off frequencies (20–50 Hz). Traveling throughout granule cell axons, signals could be conveyed to parallel fibers and then reach the second Purkinje cell synaptic stage. Here signals appear to be linearly modulated by the incoming frequency. Only the block of the inhibitory system unmasks the same frequency-dependence encountered in the other stages. This could be due to the strong action of interneurons on Purkinje cells preventing them to depolarize. Post-burst gain values were calculated 50 ms after the end of bursts both for sagittal and coronal slices (n = 4). Maximum gain and post-burst gain for parallel fibers were calculated by taking the average of 10 pixels (100 μ) in the distal part of coronal slices.

Similar articles

Cited by

References

    1. Albus J. S. (1971). A theory of cerebellar function. Math. Biosci. 10, 25–6110.1016/0025-5564(71)90051-4 - DOI
    1. Arenz A., Silver R. A., Schaefer A. T., Margrie T. W. (2008). The contribution of single synapses to sensory representation in vivo. Science 321, 977–98010.1126/science.1158391 - DOI - PMC - PubMed
    1. Armano S., Rossi P., Taglietti V., D'Angelo E. (2000). Long-term potentiation of intrinsic excitability at the mossy fiber – granule cell synapse of rat cerebellum. J. Neurosci. 20, 5208–5216 - PMC - PubMed
    1. Baginskas A., Palani D., Chiu K., Raastad M. (2009). The H-current secures action potential transmission at high frequencies in rat cerebellar parallel fibers. Eur. J. Neurosci. 29, 87–9610.1111/j.1460-9568.2008.06566.x - DOI - PubMed
    1. Bower J. M., Woolston D. C. (1983). Congruence of spatial organization of tactile projections to granule cell and Purkinje cell layers of cerebellar hemispheres of the albino rat: vertical organization of cerebellar cortex. J. Neurophysiol. 49, 745–766 - PubMed

LinkOut - more resources