3-Dimensional Scene Perception during Active Electrolocation in a Weakly Electric Pulse Fish
- PMID: 20577635
- PMCID: PMC2889722
- DOI: 10.3389/fnbeh.2010.00026
3-Dimensional Scene Perception during Active Electrolocation in a Weakly Electric Pulse Fish
Abstract
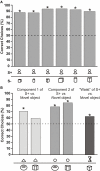
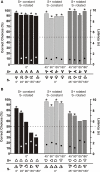
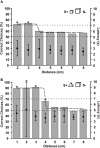
Weakly electric fish use active electrolocation for object detection and orientation in their environment even in complete darkness. The African mormyrid Gnathonemus petersii can detect object parameters, such as material, size, shape, and distance. Here, we tested whether individuals of this species can learn to identify 3-dimensional objects independently of the training conditions and independently of the object's position in space (rotation-invariance; size-constancy). Individual G. petersii were trained in a two-alternative forced-choice procedure to electrically discriminate between a 3-dimensional object (S+) and several alternative objects (S-). Fish were then tested whether they could identify the S+ among novel objects and whether single components of S+ were sufficient for recognition. Size-constancy was investigated by presenting the S+ together with a larger version at different distances. Rotation-invariance was tested by rotating S+ and/or S- in 3D. Our results show that electrolocating G. petersii could (1) recognize an object independently of the S- used during training. When only single components of a complex S+ were offered, recognition of S+ was more or less affected depending on which part was used. (2) Object-size was detected independently of object distance, i.e. fish showed size-constancy. (3) The majority of the fishes tested recognized their S+ even if it was rotated in space, i.e. these fishes showed rotation-invariance. (4) Object recognition was restricted to the near field around the fish and failed when objects were moved more than about 4 cm away from the animals. Our results indicate that even in complete darkness our G. petersii were capable of complex 3-dimensional scene perception using active electrolocation.
Keywords: environmental imaging distance; object feature; object recognition; rotational invariance; size constancy.
Figures


Similar articles
-
Three-dimensional analysis of object properties during active electrolocation in mormyrid weakly electric fishes (Gnathonemus petersii).Philos Trans R Soc Lond B Biol Sci. 2000 Sep 29;355(1401):1143-6. doi: 10.1098/rstb.2000.0655. Philos Trans R Soc Lond B Biol Sci. 2000. PMID: 11079386 Free PMC article. Review.
-
Distance discrimination during active electrolocation in the weakly electric fish Gnathonemus petersii.J Comp Physiol A. 2000-2001;186(12):1185-97. doi: 10.1007/s003590000170. J Comp Physiol A. 2000. PMID: 11288829
-
Figure-ground separation during active electrolocation in the weakly electric fish, Gnathonemus petersii.J Physiol Paris. 2013 Jan-Apr;107(1-2):72-83. doi: 10.1016/j.jphysparis.2012.03.002. Epub 2012 Apr 5. J Physiol Paris. 2013. PMID: 22504389
-
Distance, shape and more: recognition of object features during active electrolocation in a weakly electric fish.J Exp Biol. 2007 Sep;210(Pt 17):3082-95. doi: 10.1242/jeb.005694. J Exp Biol. 2007. PMID: 17704083
-
Imaging of objects through active electrolocation in Gnathonemus petersii.J Physiol Paris. 2002 Sep-Dec;96(5-6):431-44. doi: 10.1016/S0928-4257(03)00021-4. J Physiol Paris. 2002. PMID: 14692491 Review.
Cited by
-
Electrosensory capture during multisensory discrimination of nearby objects in the weakly electric fish Gnathonemus petersii.Sci Rep. 2017 Mar 3;7:43665. doi: 10.1038/srep43665. Sci Rep. 2017. PMID: 28257127 Free PMC article.
-
Temporal Code-Driven Stimulation: Definition and Application to Electric Fish Signaling.Front Neuroinform. 2016 Oct 6;10:41. doi: 10.3389/fninf.2016.00041. eCollection 2016. Front Neuroinform. 2016. PMID: 27766078 Free PMC article.
-
Perception and coding of envelopes in weakly electric fishes.J Exp Biol. 2013 Jul 1;216(Pt 13):2393-402. doi: 10.1242/jeb.082321. J Exp Biol. 2013. PMID: 23761464 Free PMC article. Review.
-
Information Is Where You Find It: Perception as an Ecologically Well-Posed Problem.Iperception. 2021 Mar 22;12(2):20416695211000366. doi: 10.1177/20416695211000366. eCollection 2021 Mar-Apr. Iperception. 2021. PMID: 33815740 Free PMC article.
-
Tracking spatial patterns and daily modulation of behavior in a natural population of the pulse-type weakly electric fish, Gymnotus omarorum.iScience. 2025 Feb 13;28(3):112018. doi: 10.1016/j.isci.2025.112018. eCollection 2025 Mar 21. iScience. 2025. PMID: 40092616 Free PMC article.
References
-
- Bastian J. (1994). Electrosensory organisms. Phys. Today 47, 30–3710.1063/1.881411 - DOI
-
- Bastian J., Zakon H. H. (2005). “Plasticity of sense organs and brain,” in Electroreception, eds Bullock T. H., Hopkins C. D., Popper A. N., Fay R. R. (New York: Springer; ), 195–228
LinkOut - more resources
Full Text Sources

