. 2010 Aug;2(7-8):371-8.
doi: 10.1039/c0ib00001a. Epub 2010 Jun 24.

3D microchannel co-culture: method and biological validation

Affiliations

3D microchannel co-culture: method and biological validation

Maret Bauer et al. Integr Biol (Camb). 2010 Aug.

Abstract

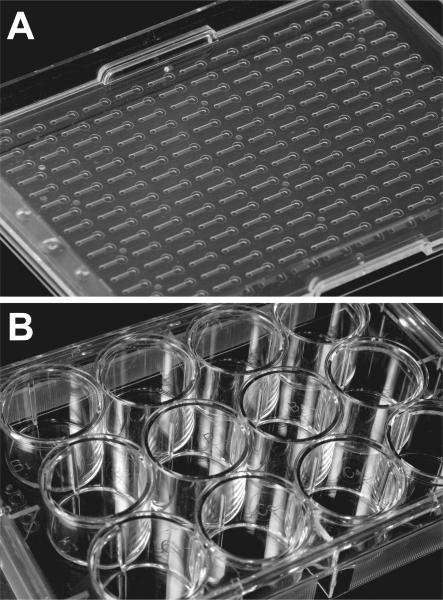
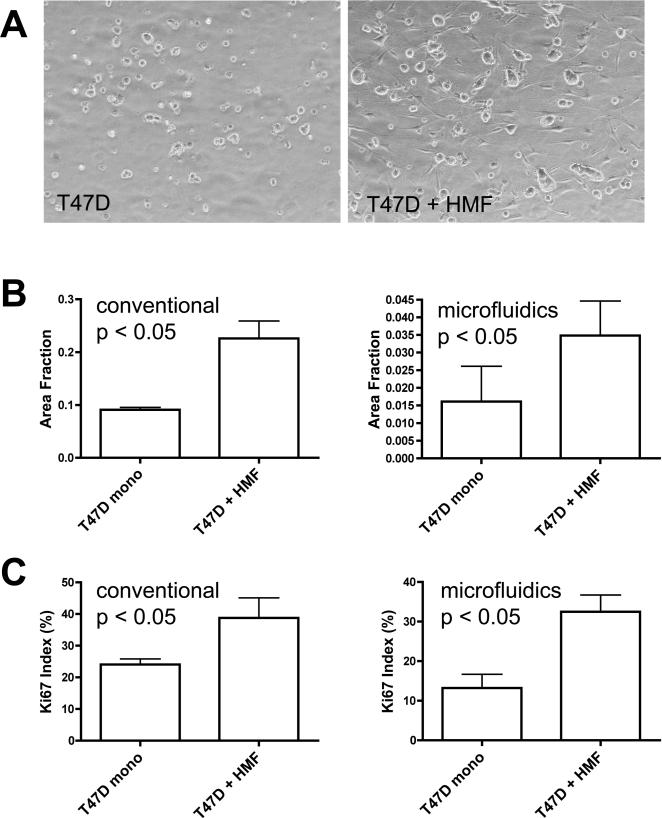
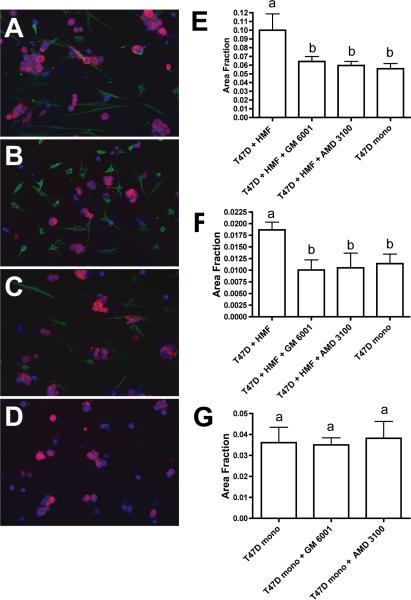
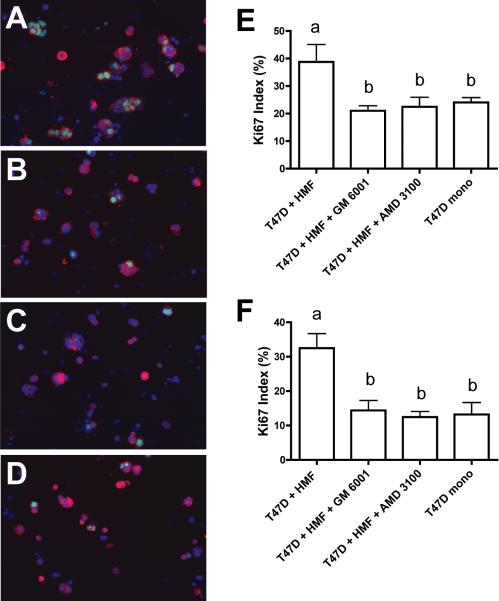
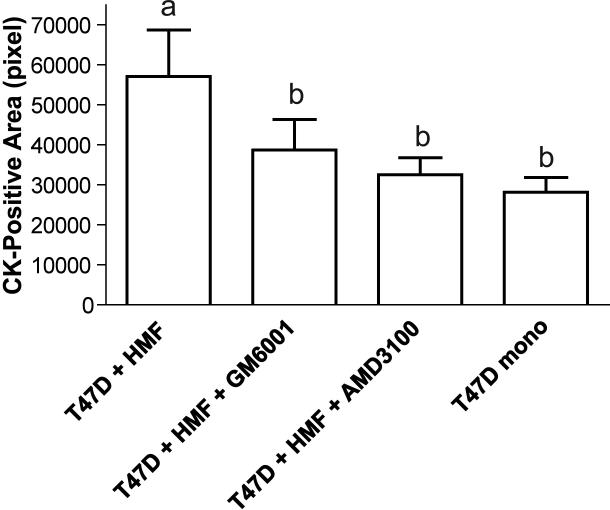
Conventional 3D culture is typically performed in multi-well plates (e.g. 12 wells). The volumes and dimensions necessitate relatively large numbers of cells and fluid exchange steps are not easily automated limiting throughput. 3D microchannel culture can overcome these challenges simplifying 3D culture processes. However, the adaptation of immunocytochemical endpoint measurements and the validation of microchannel 3D culture with conventional 3D culture are needed before widespread adoption can occur. Here we use a breast carcinoma growth model governed by complex and reciprocal interactions between epithelial carcinoma cells and mesenchymal fibroblasts to validate the 3D microculture system. Specifically, we report the use of a 3D microchannel co-culture assay platform to interrogate paracrine signalling pathways in breast cancer. Using a previously validated 3D co-culture of human mammary fibroblasts and T47D breast carcinoma cells, we demonstrate the use of arrayed microchannels to analyze paracrine signalling pathways and screen for inhibitors. Results in both conventional format (multiwell plate) and microchannels were comparable. This technology represents a significant advancement for high-throughput screening in individual patients and for drug discovery by enabling the use of 3D co-culture models via smaller sample requirements and compatibility with existing HTS infrastructure (e.g. automated liquid handlers, scanners).


Figures

Fig. 1
Fig. 1. Comparison of microfluidic and conventional culture devices
Microfluidic co-culture device with 96 arrayed single channels (photo courtesy of Steve Hayes, Bellbrook Labs) (A). Conventional 12-well culture vessel (B).
Fig. 2
Fig. 2. Relationship between carcinoma cell cluster size and cell number
T47D breast carcinoma cells were grown in 3D collagen gels in monoculture and in co-culture with HMF for 5 days. T47D cells were immunofluorescently labelled with antibodies to pancytokeratin and the nuclear dye Hoechst 33342. Thirty tumor cell clusters were randomly selected and nuclei were counted manually. The cell cluster area was determined using Image J software. Both in conventional co-culture (A) and in microfluidics co-culture (B), cluster size correlated significantly with the nucleus count and thus cell number.
Fig. 3
Fig. 3. HMF stimulate T47D breast carcinoma cell growth
Phase contrast images of 3D collagen gel cultures after 5 culture days in PDMS microfluidics channels (A). Original magnification 100x. T47D cell clusters in co-culture with HMF (right panel) are bigger than in monoculture (left panel). Quantification of total carcinoma cell cluster area as surrogate of cell number (B) and Ki67-proliferation index (C) in conventional and microfluidic 3D collagen-cultures as indicated (Error bars indicate standard deviation).
Fig. 4
Fig. 4. Growth induction of T47D breast carcinoma cells by HMF is reversed by blocking SDF-1 signalling or MMP activity
A-D. Immunofluorescence labelling of 3D collagen cultures in PDMS microchannel devices. T47D cells were labelled with an antibody to pancytokeratin (red) and HMF were labelled with an antibody to vimentin (green). Nuclei were counterstained with Hoechst 33342 (blue). A. T47D cell clusters in co-cultures with HMF. Inhibition of MMP activity by GM6001 (B) or blocking SDF-1 signalling by addition of AMD3100 (C) reduces growth of T47D cell clusters to levels seen in T47D monoculture (D). Quantification of T47D cell growth in conventional (E) and microfluidics (F) 3D collagen cultures. G. The addition of GM6001 or AMD3100 does not influence T47D cell growth in monoculture. Error bars indicate standard deviation; letters above the columns indicate the results of statistical comparisons by ANOVA. Columns sharing the same letter are not significantly different; columns labelled with different letters are significantly different (at least P< 0.05).
Fig. 5
Fig. 5. Proliferation of T47D breast carcinoma cells in co-cultures is suppressed by inhibition of SDF-1 signalling or MMP activity
A-D. Immunofluorescence labelling of 3D collagen cultures in PDMS microchannel devices after 5 culture days. Proliferative activity was assessed by labelling with an antibody to Ki67 (green). Nuclei were counterstained with Hoechst 33342 (blue). T47D cells, which were identified with an antibody to pancytokeratin (red), show increased proliferation in co-culture with HMF (A) compared to T47D cells in monoculture (D). Proliferative activity in co-cultures is suppressed by inhibition of MMP activity with GM6001 (B) or inhibition of SDF-1 signalling by the addition of AMD3100 (C). Quantitative analysis of Ki67 labelling in conventional (E) and microfluidics (F) cultures. Error bars indicate standard deviation; letters above the columns indicate the results of statistical comparisons by ANOVA. Columns sharing the same letter are not significantly different; columns labelled with different letters are significantly different (at least P< 0.05).
Fig. 6
Fig. 6. Single-channel polystyrene devices can be used for co-culture experiments and inhibitor screens; results are similar to those obtained with dual-channel PDMS devices
T47D cells and HMF were co-cultured in single-channel polystyrene devices under conditions described for figure 3. Error bars indicate standard deviation; letters above the columns indicate the results of statistical comparisons by ANOVA. Columns sharing the same letter are not significantly different; columns labelled with different letters are significantly different (at least P< 0.001).

Similar articles

Cited by

References

    1. Muthuswamy SK, Li D, Lelievre S, Bissell MJ, Brugge JS. Nature cell biology. 2001;3:785–792. - PMC - PubMed
    1. Weaver VM, Petersen OW, Wang F, Larabell CA, Briand P, Damsky C, Bissell MJ. The Journal of cell biology. 1997;137:231–245. - PMC - PubMed
    1. LaBarge MA, Nelson CM, Villadsen R, Fridriksdottir A, Ruth JR, Stampfer MR, Petersen OW, Bissell MJ. Integr Biol (Camb) 2009;1:70–79. - PMC - PubMed
    1. Jongpaiboonkit L, King WJ, Lyons GE, Paguirigan AL, Warrick JW, Beebe DJ, Murphy WL. Biomaterials. 2008;29:3346–3356. - PMC - PubMed
    1. Khetani SR, Bhatia SN. Curr Opin Biotechnol. 2006;17:524–531. - PubMed

Publication types