. 2010 Jul;64(1):249-61.
doi: 10.1002/mrm.22426.

Three-dimensional diffusion tensor microimaging for anatomical characterization of the mouse brain

Affiliations

Three-dimensional diffusion tensor microimaging for anatomical characterization of the mouse brain

Manisha Aggarwal et al. Magn Reson Med. 2010 Jul.

Abstract

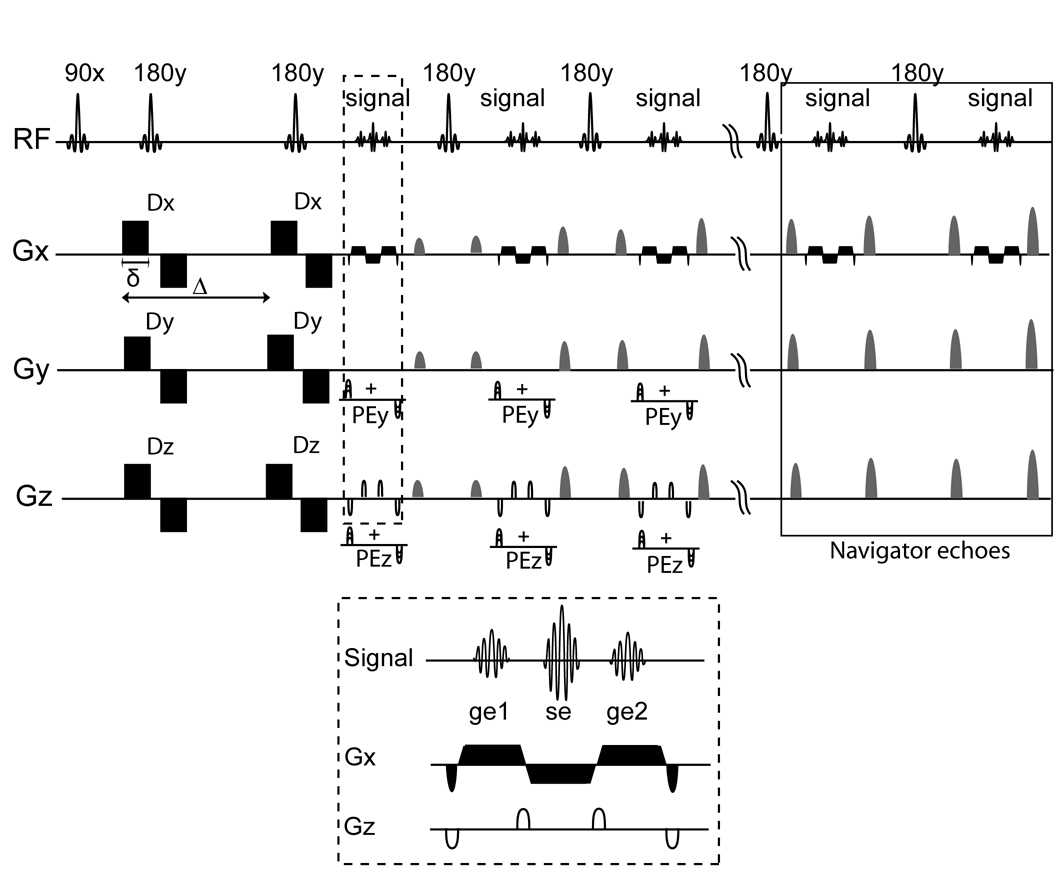
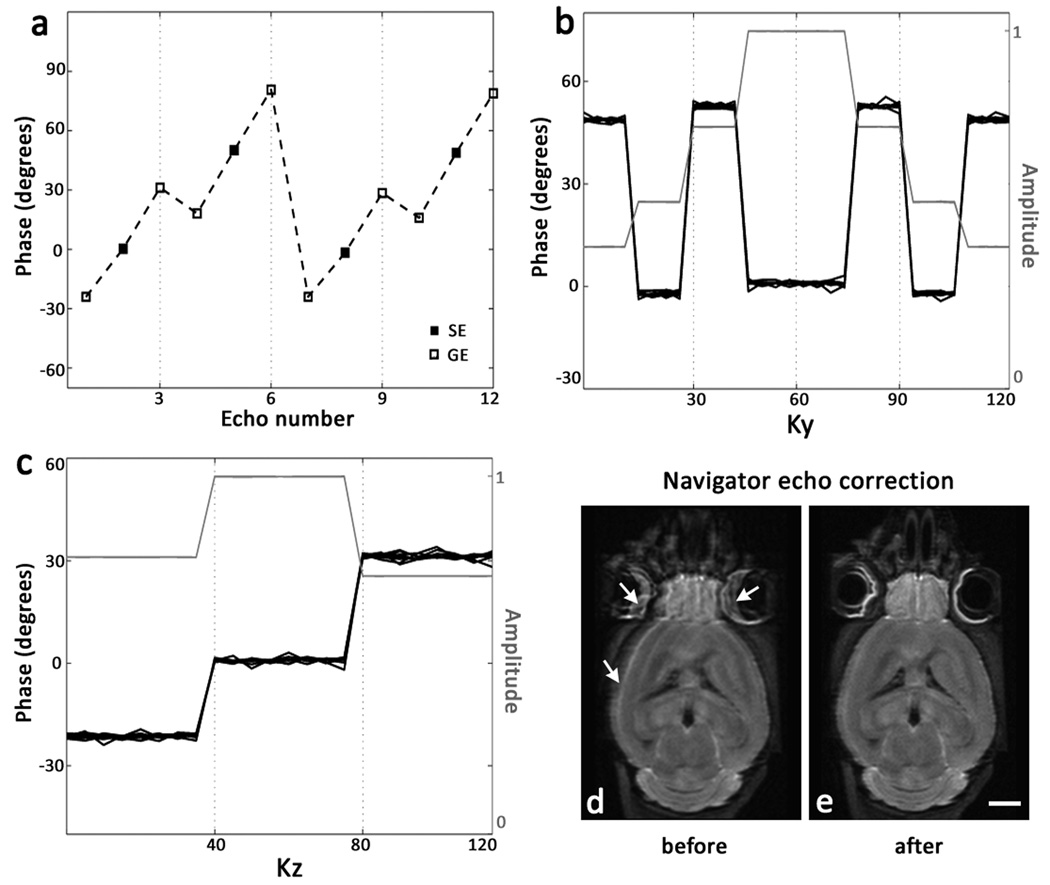
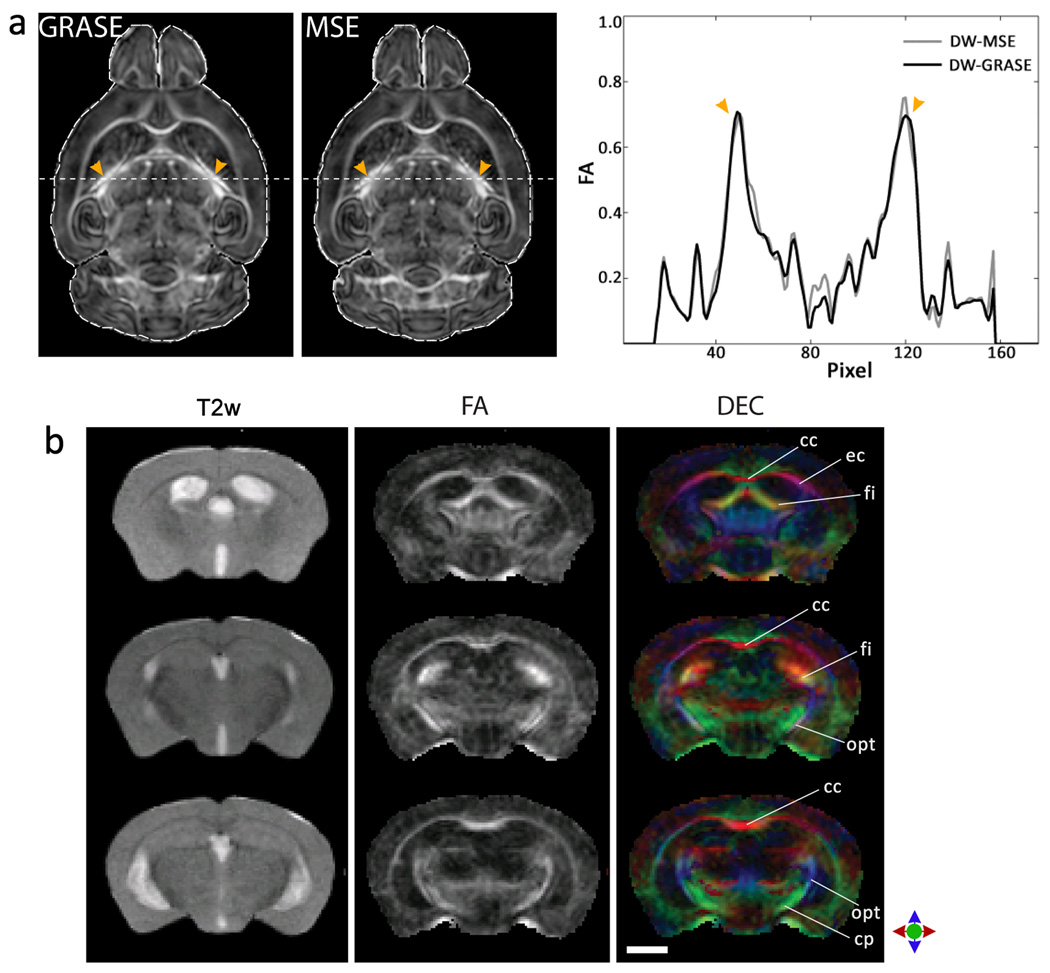
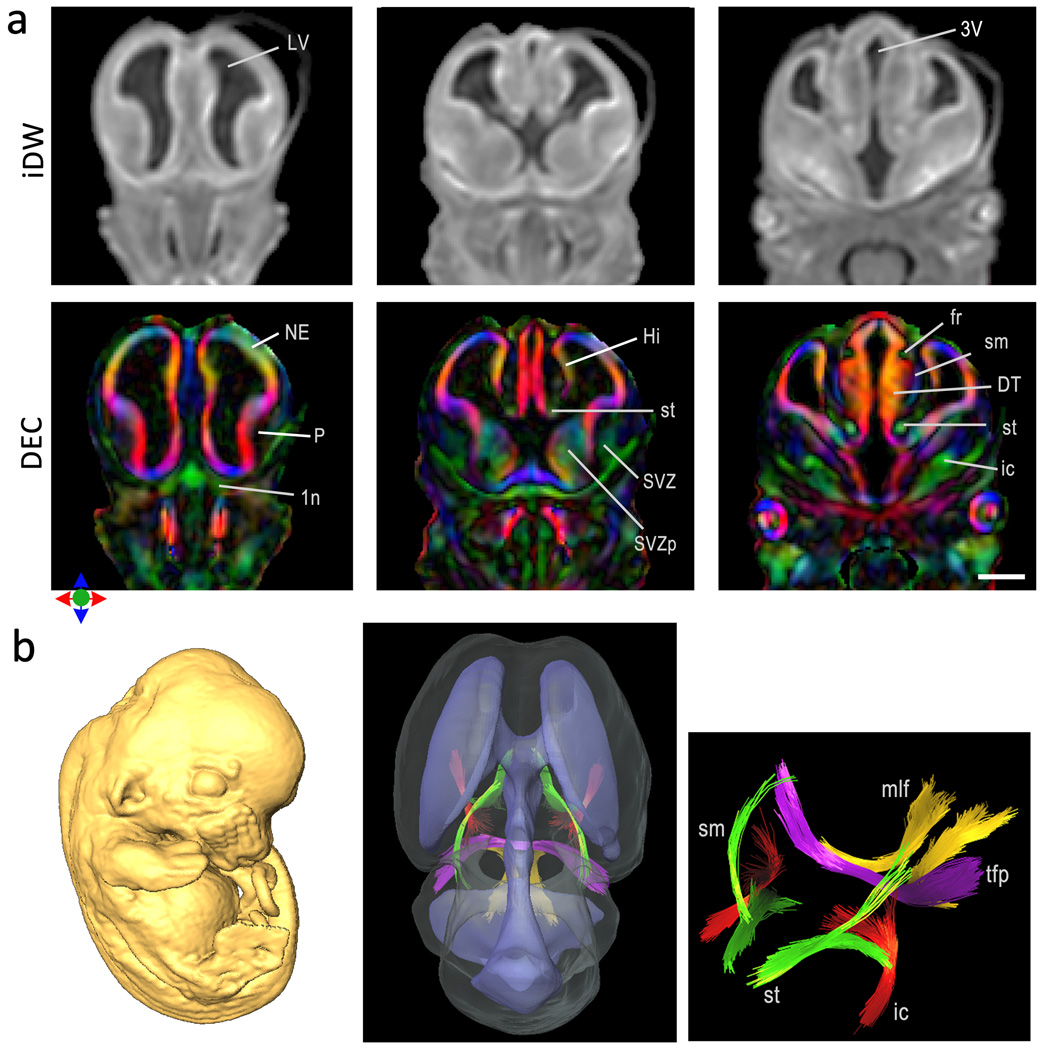
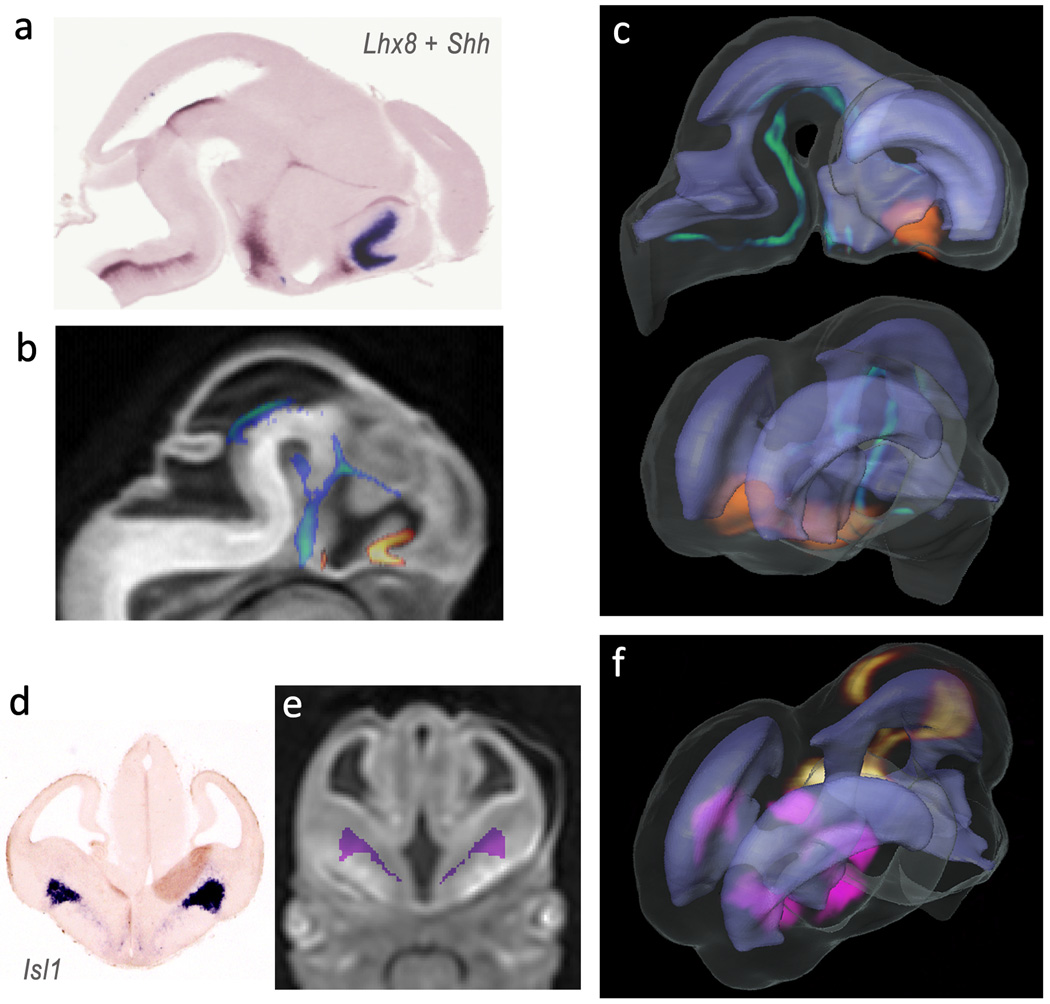
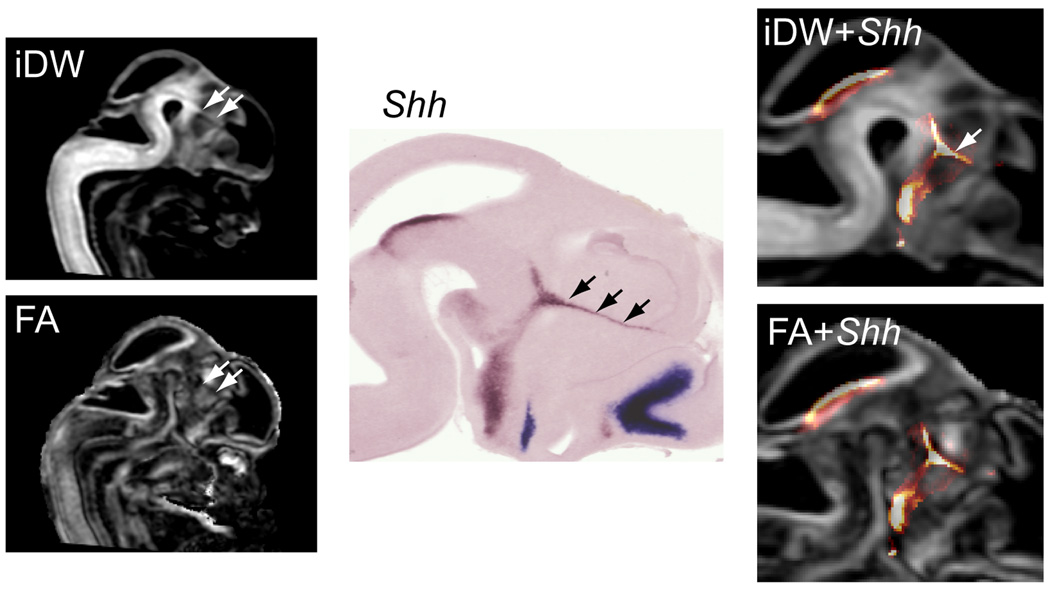
Diffusion tensor imaging is gaining increasing importance for anatomical imaging of the developing mouse brain. However, the application of diffusion tensor imaging to mouse brain imaging at microscopic levels is hindered by the limitation on achievable spatial resolution. In this study, fast diffusion tensor microimaging of the mouse brain, based on a diffusion-weighted gradient and spin echo technique with twin-navigator echo phase correction, is presented. Compared to echo planar and spin echo acquisition, the diffusion-weighted gradient and spin echo acquisition resulted in significant reduction in scan time and had minimal image distortion, thereby allowing acquisition at higher spatial resolution. In this study, three-dimensional diffusion tensor microimaging of the mouse brains at spatial resolutions of 50-60 microm revealed unprecedented anatomical details. Thin fiber bundles in the adult striatum and white matter tracts in the embryonic day 12 mouse brains were visualized for the first time. The study demonstrated that data acquired using the diffusion tensor microimaging technique allow three-dimensional mapping of gene expression data and can serve as a platform to study gene expression patterns in the context of neuroanatomy in the developing mouse brain.


Figures

Figure 1
Figure 1
Pulse sequence diagram of the 3D diffusion-weighted GRASE sequence with twin-navigator echo phase correction. Gradients Gx, Gy and Gz are used for the readout, primary and secondary phase encoding respectively. Details of the readout scheme used for GRASE acquisition (inside the dashed box, Top) are enlarged and shown at the bottom (dashed box, Bottom). Blip gradients along Gz are applied as shown for acquisition of an RF refocused spin echo (se) and two gradient echoes (ge1, ge2) after each refocusing pulse at different locations along the secondary phase encoding direction. The last two refocusing pulses are used for navigator echo acquisition in the absence of phase encoding gradients (solid box). Crusher gradient pairs of varying gradient strength centered about the RF refocusing pulses are used for rejection of the stimulated echo component. Dx, Dy, Dz are bipolar diffusion-weighting gradients, PEy and PEz denote the primary and secondary phase encoding gradients respectively.
Figure 2
Figure 2
Examples of phase modulation across the k-space and navigator-echo based phase correction in the DW-GRASE sequence. The phase data shown are acquired using an ex vivo mouse brain specimen, with a "center-out" k-space acquisition order chosen to maximize the echo amplitude at the center of the k-space along both the primary (Ky) and secondary (Kz) phase encoding axes. Echo phases shown (in (a), (b) and (c)) are obtained from an arbitrary position along the readout direction after the first Fourier transform. For reference, the phase of the spin echo after the first refocusing pulse is set to zero. In (b) and (c), the amplitude is normalized with respect to the amplitude of the first spin echo. a) Evolution of phase along the echo train with Nrf =4; showing phase oscillations between echoes from odd and even refocusing pulses, and phase differences between spin echoes (SE) and gradient echoes (GE) due to off-resonance spins. b) Phase and T2-dependent amplitude modulation along Ky, for echoes at the center along Kz. c) Phase and T2*-dependent amplitude modulation along Kz, for echoes at the center along Ky. d) and e) Representative DW image from an adult mouse brain before and after navigator echo phase correction. Phase discontinuities result in ghost artifacts and blurred tissue edges in the uncorrected image (white arrows in (d)), which are corrected by navigator echo phase correction.
Figure 3
Figure 3
a) Comparison of fractional anisotropy (FA) images from MSE- and GRASE- based ex vivo DTI. Corresponding axial sections from FA maps of an adult mouse brain for DW-GRASE and DW-MSE acquisitions are shown. Overlaying the brain contour from the MSE image onto the GRASE image reveals no discernible geometric distortions. Pixel-wise comparison of FA profiles along the dashed lines are shown on the right. Arrowheads indicate the brain structures with high diffusion anisotropy corresponding to the two peaks in the FA profiles. For DTI mapping, GRASE images are acquired at a spatial resolution of 0.125 × 0.125 × 0.125 mm3, with 6 diffusion directions and 4 signal averages. MSE images are acquired with the same spatial resolution and diffusion directions, and 2 signal averages. Total scan time is 15 hours for MSE-based DTI and 5 hours for GRASE-based DTI. b) GRASE-based in vivo DTI showing coronal sections from FA and DEC maps of an adult mouse brain. Comparison with in vivo T2-weighted images (left) acquired using the RARE sequence reveals no discernible geometric distortions. In the DEC maps, red, blue and green represent diffusion anisotropy along the medial-lateral, dorsal-ventral and rostral-caudal axes respectively. Structural abbreviations for labeled white matter tracts are: cc: corpus callosum, cp: cerebral peduncle, ec: external capsule, fi: fimbria, opt: optic tract. Scale bar = 2 mm.
Figure 4
Figure 4
DTMI of an adult mouse brain acquired at 55 µm resolution. a) DTI based contrasts in orthogonal sections through the brain. Isotropically diffusion weighted (iDW) images and direction encoded color (DEC) maps are shown in the left and right semi-sections of the brain respectively. In the DEC maps, red, blue and green represent diffusion anisotropy along the medial-lateral, dorsal-ventral and rostral-caudal axes respectively. b) Comparison of anatomical details revealed by DTI at 55 µm (left panel), 80 µm (middle panel), and 125 µm (right panel) resolutions. Sagittal sections at the level of the striatum are shown; high resolution DTI revealed fine microstructural organization of white matter fibers within the striatum (white arrows, right panel), which could not be resolved at lower resolutions (middle, left panels). Abbreviations used are Cx: cortex, cc: corpus callosum, SC: superior colliculus. Scale bars = 1 mm.
Figure 5
Figure 5
DTMI of an isolated mouse cerebellum at postnatal day 12 (P12) acquired at 50 µm resolution. a) 3D volume rendering of the cerebellum. b) DEC map of a coronal section through the cerebellum. Red, green and blue represent diffusion anisotropy along the medial-lateral, rostral-caudal and dorsal-ventral axes respectively. C) Comparison of mid-sagittal T2-weighted image, fractional anisotropy image and DEC map through the cerebellar vermis. Scale bar = 1 mm.
Figure 6
Figure 6
DTMI of the embryonic mouse brain at E12 acquired at 60 µm resolution. a) Coronal sections through the E12 brain showing isotropically diffusion-weighted (iDW) images and direction encoded color (DEC) maps. In the DEC maps, red, green and blue represent diffusion anisotropy along the medial-lateral, rostral-caudal and dorsal-ventral axes respectively. Brain structures that can be delineated from diffusion orientation based contrasts are labeled. Scale bar = 0.5 mm. Structural abbreviations are: LV: lateral ventricle, 3V: third ventricle, NE: neuroepithelium, P: Pallidum, 1n: olfactory nerve, Hi: Hippocampus, st: stria terminalis, SVZ: striatal subventricular zone, SVZp: pallidal subventricular zone, fr: fasciculus retroflexus, DT: dorsal thalamus, ic: internal capsule, sm: stria medularis. b) 3D reconstruction of structures inside the E12 mouse brain. Surface rendering of the brain and ventricular volumes shows the 3D spatial trajectories of early developing white matter tracts delineated by fiber tracking. Magnified view of the delineated axonal tracts shows the st (green), sm (green), ic (red), medial longitudinal fasciculus (mlf, yellow) and transverse pontine fibers (tfp, purple).
Figure 7
Figure 7
Mapping of gene expression data to high resolution 3D MR images in an E12 mouse embryo. Lhx8 + Shh expression data from two-color sagittal ISH sections (a), and Isl1 (d) and Pitx2 expression data from serial coronal ISH sections were mapped to the MR images using intensity and landmark based registration. The expression patterns after coregistration are overlaid on corresponding 2D sections from the MR images (b,f). After the mapping procedures, the gene expression patterns of Shh (green), Lhx8 (orange), Isl1 (pink) and Pitx2 (yellow) are visualized in 3D (c,f) to reveal their relative spatial distributions within the brain and spatial correlations with surrounding anatomical structures such as the ventricles (rendered in light purple).
Figure 8
Figure 8
Mapping the Shh gene expression data to the MR images in an E12 mouse brain helped to locate the zona limitans interthalamica (ZLI) in the early thalamus. In high resolution diffusion-weighted (iDW) and fractional anisotropy (FA) images of an E12 mouse embryo (left panel), the region indicated by the white arrows can be differentiated from surrounding tissues, and may correspond to the ZLI. In the sagittal ISH section stained for Shh expression (middle), the ZLI is clearly visible (indicated by black arrows). After mapping the Shh expression data to the MR images, the location of ZLI in MR images is confirmed (right panel).

Similar articles

Cited by

References

    1. Sunkin SM. Towards the integration of spatially and temporally resolved murine gene expression databases. Trends in Genetics. 2006;22(4):211–217. - PubMed
    1. Paxinos G, Halliday GH, Watson C, Koutcherov Y, Wang H. Atlas of the Developing Mouse Brain at E17.5, P0 and P6. Academic Press; 2006.
    1. Lein ES, Hawrylycz MJ, Ao N, Ayres M, Bensinger A, Bernard A, Boe AF, Boguski MS, Brockway KS, Byrnes EJ, Chen L, Chen TM, Chin MC, Chong J, Crook BE, Czaplinska A, Dang CN, Datta S, Dee NR, Desaki AL, Desta T, Diep E, Dolbeare TA, Donelan MJ, Dong HW, Dougherty JG, Duncan BJ, Ebbert AJ, Eichele G, Estin LK, Faber C, Facer BA, Fields R, Fischer SR, Fliss TP, Frensley C, Gates SN, Glattfelder KJ, Halverson KR, Hart MR, Hohmann JG, Howell MP, Jeung DP, Johnson RA, Karr PT, Kawal R, Kidney JM, Knapik RH, Kuan CL, Lake JH, Laramee AR, Larsen KD, Lau C, Lemon TA, Liang AJ, Liu Y, Luong LT, Michaels J, Morgan JJ, Morgan RJ, Mortrud MT, Mosqueda NF, Ng LL, Ng R, Orta GJ, Overly CC, Pak TH, Parry SE, Pathak SD, Pearson OC, Puchalski RB, Riley ZL, Rockett HR, Rowland SA, Royall JJ, Ruiz MJ, Sarno NR, Schaffnit K, Shapovalova NV, Sivisay T, Slaughterbeck CR, Smith SC, Smith KA, Smith BI, Sodt AJ, Stewart NN, Stumpf KR, Sunkin SM, Sutram M, Tam A, Teemer CD, Thaller C, Thompson CL, Varnam LR, Visel A, Whitlock RM, Wohnoutka PE, Wolkey CK, Wong VY, Wood M, Yaylaoglu MB, Young RC, Youngstrom BL, Yuan XF, Zhang B, Zwingman TA, Jones AR. Genome-wide atlas of gene expression in the adult mouse brain. Nature. 2007;445(7124):168–176. - PubMed
    1. Venkataraman S, Stevenson P, Yang Y, Richardson L, Burton N, Perry TP, Smith P, Baldock RA, Davidson DR, Christiansen JH. EMAGE--Edinburgh Mouse Atlas of Gene Expression: 2008 update. Nucleic Acids Res. 2008;36(Database issue):D860–D865. - PMC - PubMed
    1. Sharpe J, Ahlgren U, Perry P, Hill B, Ross A, Hecksher-Sorensen J, Baldock R, Davidson D. Optical projection tomography as a tool for 3D microscopy and gene expression studies. Science. 2002;296(5567):541–545. - PubMed

Publication types

Substances