. 2010 Jul;52(1):47-59.
doi: 10.1002/hep.23671.

Hepatocyte NAD(P)H oxidases as an endogenous source of reactive oxygen species during hepatitis C virus infection

Affiliations

Hepatocyte NAD(P)H oxidases as an endogenous source of reactive oxygen species during hepatitis C virus infection

Nabora Soledad Reyes de Mochel et al. Hepatology. 2010 Jul.

Abstract

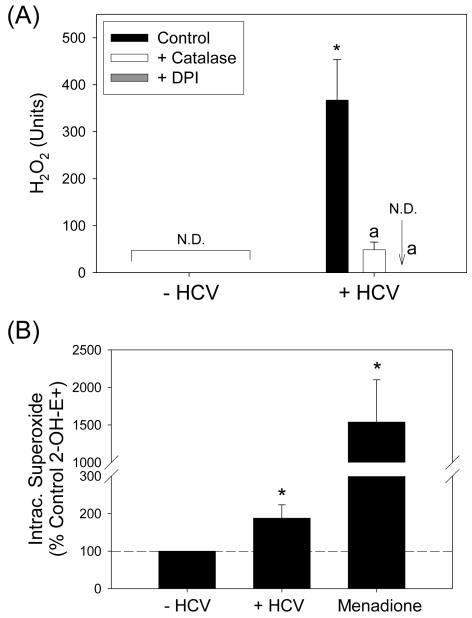
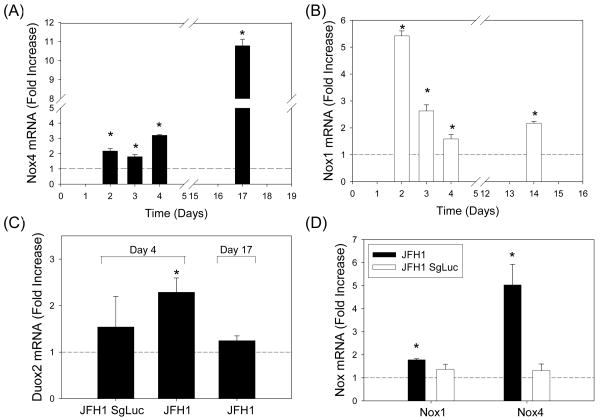
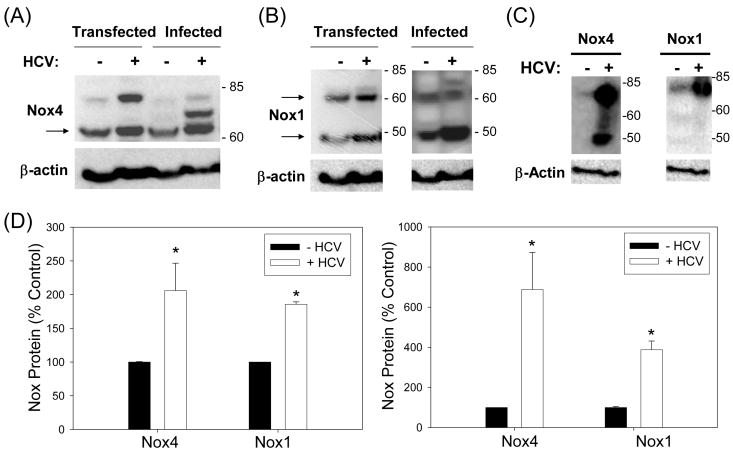
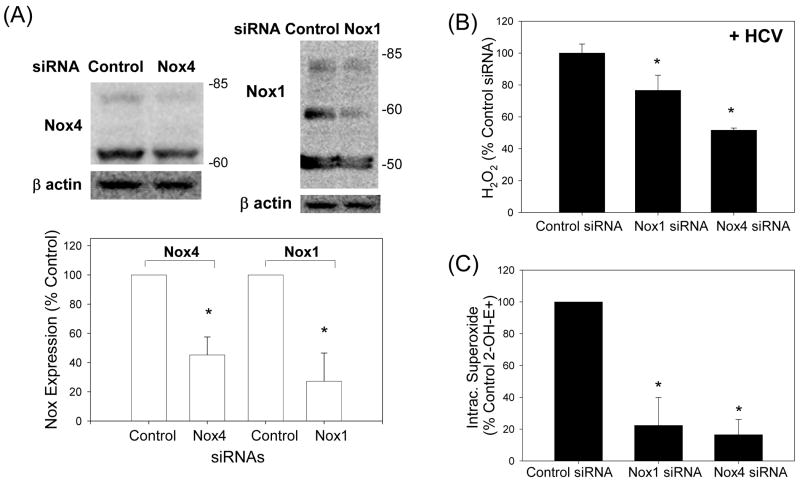
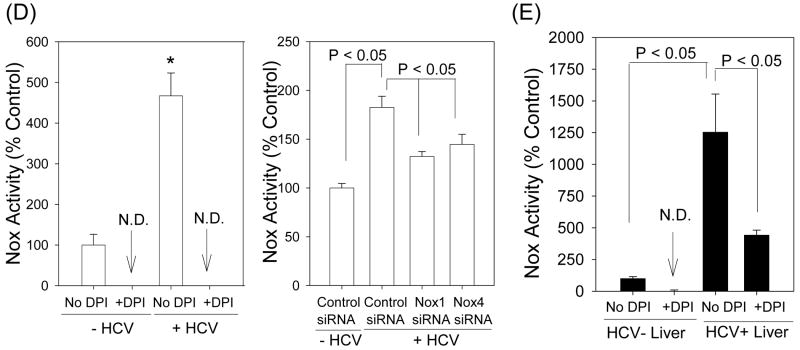
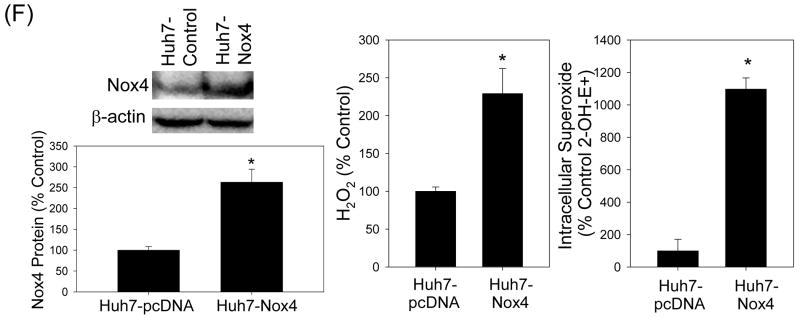
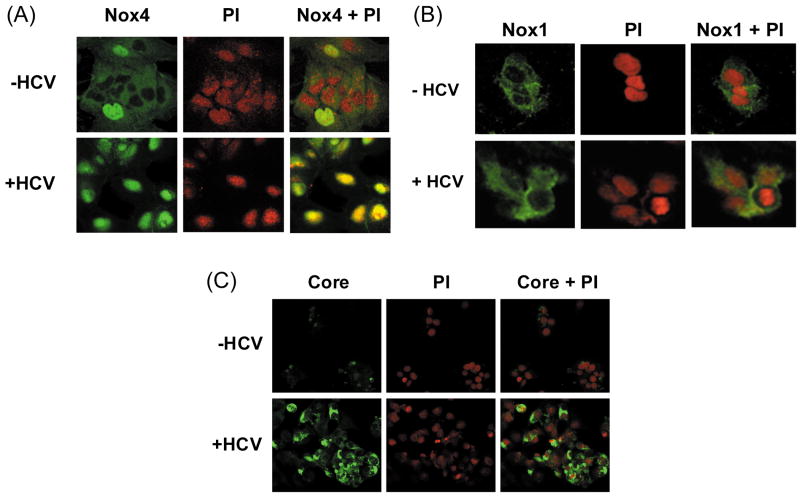
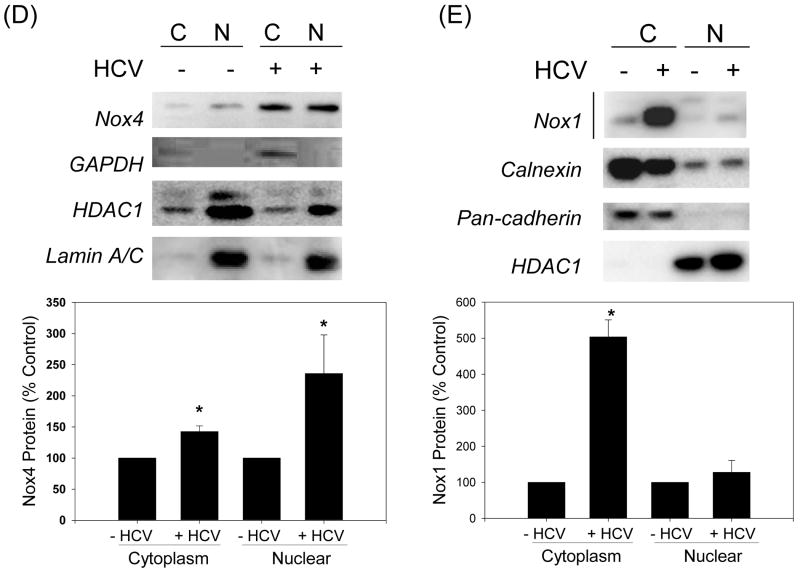
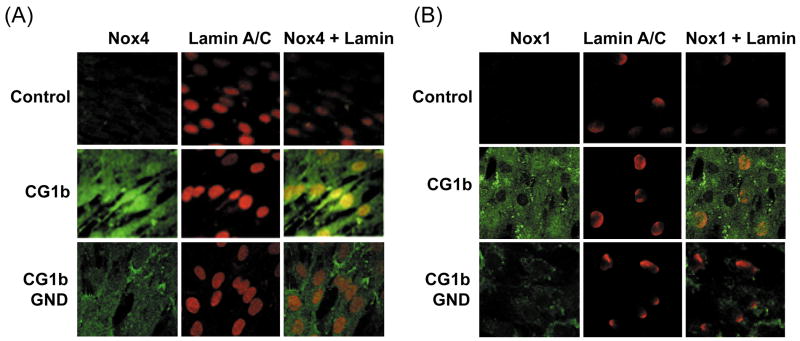
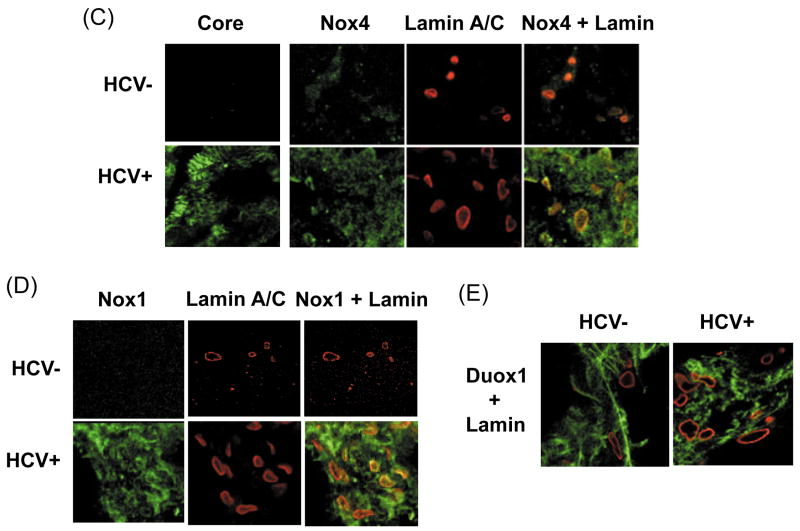
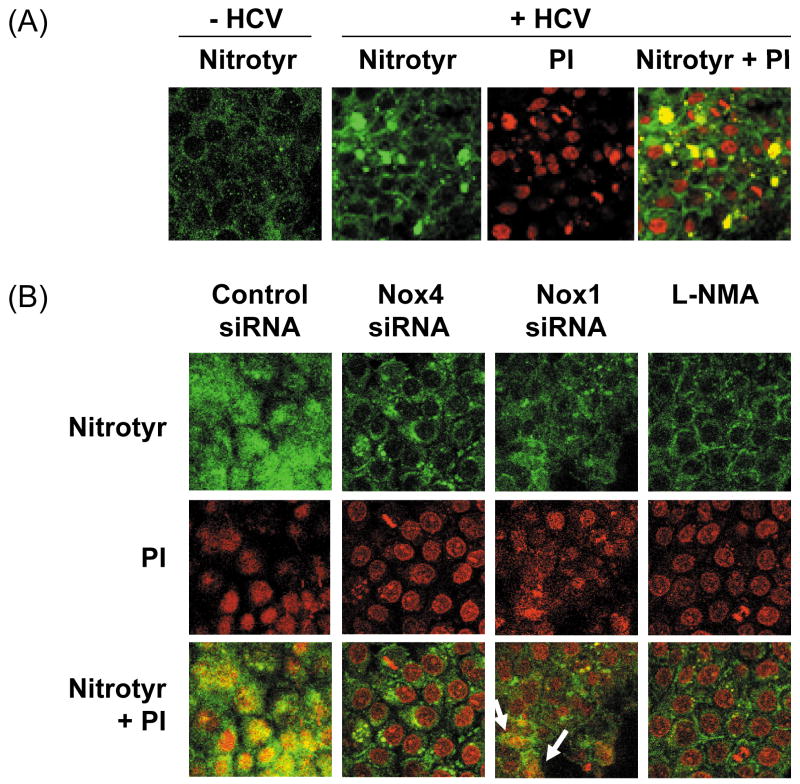
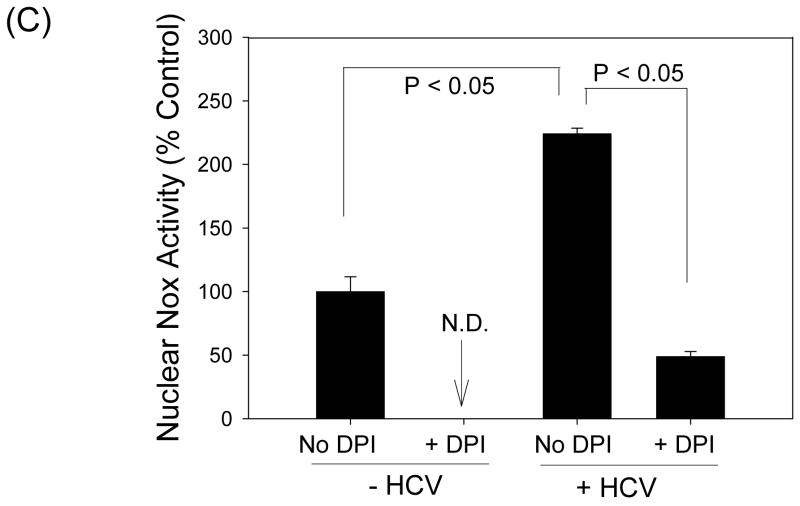
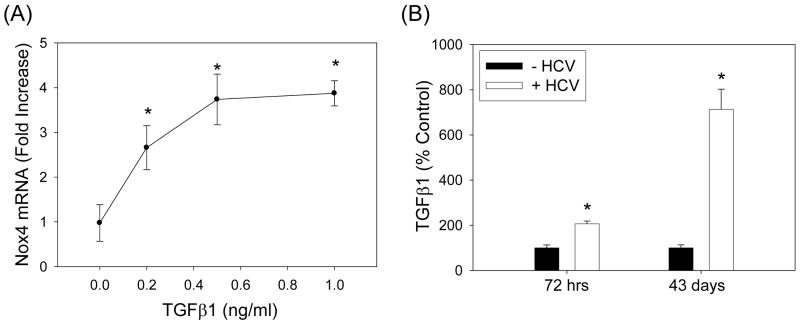
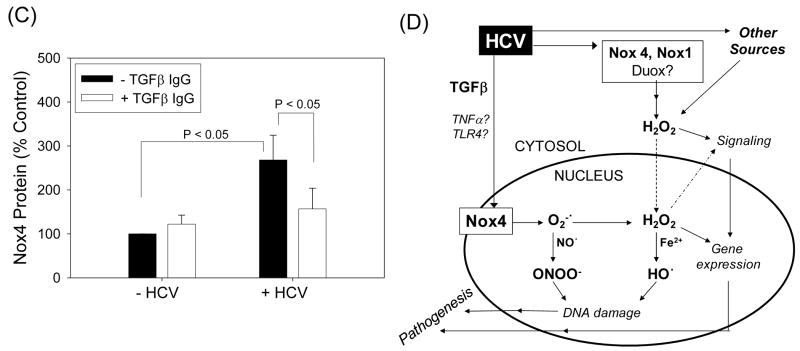
Oxidative stress has been identified as a key mechanism of hepatitis C virus (HCV)-induced pathogenesis. Studies have suggested that HCV increases the generation of hydroxyl radical and peroxynitrite close to the cell nucleus, inflicting DNA damage, but the source of reactive oxygen species (ROS) remains incompletely characterized. We hypothesized that HCV increases the generation of superoxide and hydrogen peroxide close to the hepatocyte nucleus and that this source of ROS is reduced nicotinamide adenine dinucleotide phosphate (NAD(P)H) oxidase 4 (Nox4). Huh7 human hepatoma cells and telomerase-reconstituted primary human hepatocytes, transfected or infected with virus-producing HCV strains of genotypes 2a and 1b, were examined for messenger RNA (mRNA), protein, and subcellular localization of Nox proteins along with the human liver. We found that genotype 2a HCV induced persistent elevations of Nox1 and Nox4 mRNA and proteins in Huh7 cells. HCV genotype 1b likewise elevated the levels of Nox1 and Nox4 in telomerase-reconstituted primary human hepatocytes. Furthermore, Nox1 and Nox4 proteins were increased in HCV-infected human liver versus uninfected liver samples. Unlike Nox1, Nox4 was prominent in the nuclear compartment of these cells as well as the human liver, particularly in the presence of HCV. HCV-induced ROS and nuclear nitrotyrosine could be decreased with small interfering RNAs to Nox1 and Nox4. Finally, HCV increased the level of transforming growth factor beta 1 (TGFbeta1). TGFbeta1 could elevate Nox4 expression in the presence of infectious HCV, and HCV increased Nox4 at least in part through TGFbeta1.

Conclusion: HCV induced a persistent elevation of Nox1 and Nox4 and increased nuclear localization of Nox4 in hepatocytes in vitro and in the human liver. Hepatocyte Nox proteins are likely to act as a persistent, endogenous source of ROS during HCV-induced pathogenesis.


Figures

Fig. 1
Fig. 1. HCV increases the level of ROS
Huh7 cells transfected with virus-producing JFH1 HCV RNA or mock-transfected were analyzed for H2O2 by p-hydroxyphenylaminoacetic acid dimerization assay (A) and intracellular superoxide by measuring 2-OH-E+ by HPLC (B). Menadione (50 μM) plus diethyldithiocarbamate (3 mM, inhibitor of superoxide dismutase; added 30 min prior to HE) served as the positive control for the detection of 2-OH-E+ (B). When used, DPI was added at 10 μM concentration 30 min prior to the assays. Catalase was added at the final concentration of 200 U/ml. Data were normalized by total protein. *, a indicate statistically significant difference from HCV− or HCV+ controls, respectively (P < 0.05); N.D. indicates “non-detectable” (below baseline).
Fig. 2
Fig. 2. Differential expression of Hepatocyte Nox mRNAs in Huh7 cells generating infectious HCV
Huh7 cells were transfected with virus-producing full-length JFH1 RNA, non-virus-producing subgenomic JFH1 RNA, or mock-transfected (control) and analyzed for Nox4 (A, D), Nox1 (B, D), and Duox2 (C) mRNAs by qRT-PCR. Data were calculated and normalized by 18S rRNA or GAPDH mRNA by ΔΔCt method and expressed as fold increase from the controls. * indicates statistically significant difference from the controls (P < 0.05).
Fig. 3
Fig. 3. Hepatocyte Nox1 and Nox4 proteins are increased with HCV
Huh7 cells were transfected with virus-producing full-length JFH1 RNA or mock-transfected, or infected with medium from the HCV RNA and GND RNA-transfected cells, and analyzed for Nox4 (A) and Nox1 (B) protein levels by western blots. Human liver samples from HCV-infected and non-infected donors (National Disease Research Exchange, NDRI) were also analyzed for Nox1 and Nox4 proteins by western blots (C). β-actin was analyzed as loading control. (D) Nox1 (50 kDa) and Nox4 (65 kDa) protein levels in control and JFH1 cells (left panel), and Nox1 and Nox4 proteins (> 60 kDa) in human liver tissues (right panel) were quantified by densitometry and normalized by the level of β-actin. * indicates statistically significant difference from the controls (P < 0.05). Arrows indicate expected sizes of Nox1 and Nox4.
Fig. 4
Fig. 4. Role of Nox enzymes in HCV-induced ROS
(A – C) Twenty four hrs after JFH1 RNA transfection, Huh7 cells were transfected with non-targeting control siRNA, Nox1 siRNA, or Nox4 siRNA and, after another 72 hrs, analyzed for the level of Nox1 and Nox4 proteins by western blots (A), H2O2 by p-hydroxyphenylaminoacetic acid dimerization assay (B), and intracellular superoxide by measuring 2-OH-E+ via HPLC (C). (D) Cells were permeabilized with intracellular-like buffer containing 40 μM digitonin, and Nox enzyme activities were determined by monitoring NADPH-dependent and SOD-inhibited reduction of cytochrome c, in the presence and absence of 30 μM DPI, as described in the Supplement. Activity assays were also carried out after transfecting cells with non-targeting control siRNA, Nox1 siRNA, or Nox4 siRNA. (E) Human liver samples were sonicated in intracellular-like buffer, and SOD-inhibited reduction of cytochrome c was determined in the presence and absence of DPI, as described in the Supplement. (F) Huh7 cells stably transfected with Nox4 cDNA or empty plasmid vector (pcDNA) alone were analyzed for Nox4 protein, H2O2, and superoxide, as described. Nox proteins were quantified by densitometry and normalized by β-actin. Data in (B - F) were normalized by total protein. * indicates statistically significant difference from controls (P < 0.05). N.D. indicates “non-detectable” (below baseline).
Fig. 5
Fig. 5. Subcellular localization of Nox1 and Nox4 enzymes in control vs. HCV-replicating cells
(A – C) Huh7 cells transfected with JFH1 HCV RNA and mock-transfected control cells were analyzed for subcellular location of Nox1 (A), Nox4 (B), and HCV core (C) proteins by confocal microscopy. Nucleus was counter stained with PI in (A – C). (D - E) Control and JFH1-transfected Huh7 cells were fractionated and analyzed for Nox1 and Nox4 proteins by western blots. Samples were also analyzed for cytoplasmic (GAPDH, calnexin, cadherin) and nuclear (HDAC1, lamin A/C) markers. Nox1 and Nox4 protein bands were quantified by densitometry, and normalized by HDAC1 or calnexin for nuclear and cytoplasmic fractions, respectively. C indicates cytoplasmic fraction; N indicates nuclear fraction. * indicates statistically significant difference from the controls (P < 0.05).
Fig. 6
Fig. 6. Hepatocyte Nox1 and Nox4 in genotype 1b HCV-replicating cells and human liver
(A – B) Telomerase-reconstituted primary human hepatocytes, stably transfected with pEF-CG1bRbz/Neo, pEF-CG1bRbz GND/Neo, or control vector alone, were analyzed for Nox4 (A) and Nox1 proteins (B) by confocal microscopy. Lamin A/C was also analyzed as a nuclear marker. (C – E) HCV-infected (HCV+) and un-infected (HCV-) human liver samples were analyzed for Nox4 (C), Nox1 (D), and Duox1 (E) proteins by immunofluorescence, using confocal microscopy. Nuclear membrane was stained with lamin A/C. Nox/Duox proteins are shown in green and lamin A/C, in red in (C – E).
Fig. 7
Fig. 7. HCV, Nox enzymes, and nitrotyrosine
(A) Nitrotyrosine in control and JFH1 cells was analyzed by immunofluorescence via confocal microscopy. (B) JFH1 transfected cells were transfected with control, Nox1, or Nox4 siRNAs, or transfected with control siRNA and treated with 1 mM L-NMA. Then, the samples were analyzed for nitrotyrosine, as described. Nucleus was counter-stained with PI. (C) Nuclear fractions were isolated from JFH1 and mock-transfected cells as described in the Experimental Procedures, and Nox activity was analyzed by monitoring NADPH-dependent and SOD-inhibited reduction of cytochrome c, in the presence and absence of 30 μM DPI. N.D. indicates “non-detectable” (below baseline).
Fig. 8
Fig. 8. Role of TGFβ in the modulation of Nox4 by HCV
(A) Huh7 cells transfected with JFH1 RNA were cultured with heat-inactivated serum overnight, serum-starved for 24 hrs, and treated with indicated concentrations of recombinant human TGFβ1 (R&D Systems) daily for another 72 hrs. Then, samples were analyzed for Nox4 mRNA by qPCR. Data were normalized by GAPDH mRNA content. (B) Cell culture medium from control and JFH1 cells were analyzed for TGFβ1 concentration. Data were normalized by cell number and expressed as percentage of controls, where control values were 2,133.5 ± 277.9 and 2,720.8 ± 359.6 pg per 106 cells at 72 hrs and 43 days, respectively. TGFβ1 present in the cell culture serum was subtracted from the readings. (C) Control and JFH1 cells were incubated with 2 μg/ml of anti-TGFβ1 antibodies (R&D Systems) and, after 48 or 72 hrs, analyzed for Nox4 protein concentration by Western blots. Nox4 protein was quantified by densitometry and normalized by the level of β-actin. * indicates statistically significant difference from controls (P < 0.05). (D) Proposed role of hepatocyte Nox proteins in HCV-induced pathogenesis.

References

    1. Seronello S, Sheikh MY, Choi J. Redox regulation of hepatitis C in nonalcoholic and alcoholic liver. Free Radic Biol Med. 2007;43:869–882. - PubMed
    1. Garcia-Monzon C, Majano PL, Zubia I, Sanz P, Apolinario A, Moreno-Otero R. Intrahepatic accumulation of nitrotyrosine in chronic viral hepatitis is associated with histological severity of liver disease. J Hepatol. 2000;32:331–338. - PubMed
    1. Rouille Y, Helle F, Delgrange D, Roingeard P, Voisset C, Blanchard E, Belouzard S, et al. Subcellular localization of hepatitis C virus structural proteins in a cell culture system that efficiently replicates the virus. J Virol. 2006;80:2832–2841. - PMC - PubMed
    1. Okuda M, Li K, Beard MR, Showalter LA, Scholle F, Lemon SM, Weinman SA. Mitochondrial injury, oxidative stress, and antioxidant gene expression are induced by hepatitis C virus core protein. Gastroenterology. 2002;122:366–375. - PubMed
    1. Beckman JS, Koppenol WH. Nitric oxide, superoxide, and peroxynitrite: the good, the bad, and ugly. Am J Physiol. 1996;271:C1424–1437. - PubMed

Publication types