Prairie voles as a novel model of socially facilitated excessive drinking
- PMID: 20579002
- PMCID: PMC2950896
- DOI: 10.1111/j.1369-1600.2010.00234.x
Prairie voles as a novel model of socially facilitated excessive drinking
Abstract
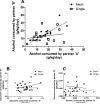
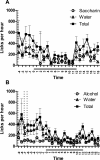
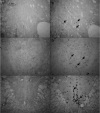
Social relationships strongly affect alcohol drinking in humans. Traditional laboratory rodents do not exhibit social affiliations with specific peers, and cannot adequately model how such relationships impact drinking. The prairie vole is a socially monogamous rodent used to study social bonds. The present study tested the prairie vole as a potential model for the effects of social affiliations on alcohol drinking. Same-sex adult sibling prairie voles were paired for five days, and then either separated into individual cages, or housed in pairs. Starting at the time of separation, the voles received unlimited access to alcohol in a two-bottle choice test versus water. Pair-housed siblings exhibited higher preference for alcohol, but not saccharin, than singly housed voles. There was a significant correlation between the amount of alcohol consumed by each member of a pair when they were housed together (r = 0.79), but not when housed apart (r = 0.20). Following automated analysis of circadian patterns of fluid consumption indicating peak fluid intake before and after the dark phase, a limited access two-hour two-bottle choice procedure was established. Drinking in this procedure resulted in physiologically relevant blood ethanol concentrations and increased Fos immunoreactivity in perioculomotor urocortin containing neurons (but not in nucleus accumbens or central nucleus of the amygdala). The high ethanol preference and sensitivity to social manipulation indicate that prairie voles can serve to model social influences on excessive drinking.
© 2010 The Authors. Addiction Biology © 2010 Society for the Study of Addiction.
Figures


Comment in
-
The value of unusual animal models for alcohol research: a commentary on: Anacker, Loftis, and Ryabinin, "alcohol intake in prairie voles is influenced by the drinking level of a peer".Alcohol Clin Exp Res. 2011 Aug;35(8):1379-80. doi: 10.1111/j.1530-0277.2011.01582.x. Epub 2011 Jun 8. Alcohol Clin Exp Res. 2011. PMID: 21651584 Free PMC article.
Similar articles
-
Alcohol intake in prairie voles is influenced by the drinking level of a peer.Alcohol Clin Exp Res. 2011 Oct;35(10):1884-90. doi: 10.1111/j.1530-0277.2011.01533.x. Epub 2011 May 16. Alcohol Clin Exp Res. 2011. PMID: 21575019 Free PMC article.
-
The role of early life experience and species differences in alcohol intake in microtine rodents.PLoS One. 2012;7(6):e39753. doi: 10.1371/journal.pone.0039753. Epub 2012 Jun 22. PLoS One. 2012. PMID: 22745824 Free PMC article.
-
Establishment of stable dominance interactions in prairie vole peers: relationships with alcohol drinking and activation of the paraventricular nucleus of the hypothalamus.Soc Neurosci. 2014;9(5):484-94. doi: 10.1080/17470919.2014.931885. Epub 2014 Jun 25. Soc Neurosci. 2014. PMID: 24963825 Free PMC article.
-
Prairie Voles as a Model to Screen Medications for the Treatment of Alcoholism and Addictions.Int Rev Neurobiol. 2016;126:403-21. doi: 10.1016/bs.irn.2016.02.019. Epub 2016 Mar 21. Int Rev Neurobiol. 2016. PMID: 27055620 Review.
-
Intermittent ethanol access schedule in rats as a preclinical model of alcohol abuse.Alcohol. 2014 May;48(3):243-52. doi: 10.1016/j.alcohol.2014.01.006. Epub 2014 Mar 15. Alcohol. 2014. PMID: 24721195 Free PMC article. Review.
Cited by
-
Animal models of social contact and drug self-administration.Pharmacol Biochem Behav. 2015 Sep;136:47-54. doi: 10.1016/j.pbb.2015.06.013. Epub 2015 Jul 6. Pharmacol Biochem Behav. 2015. PMID: 26159089 Free PMC article. Review.
-
Effects of pharmacological inhibition of the centrally-projecting Edinger-Westphal nucleus on ethanol-induced conditioned place preference and body temperature.Alcohol. 2020 Sep;87:121-131. doi: 10.1016/j.alcohol.2020.01.002. Epub 2020 Jan 9. Alcohol. 2020. PMID: 31926294 Free PMC article.
-
Effects of social housing on alcohol intake in mice depend on the non-social environment.Front Behav Neurosci. 2024 May 16;18:1380031. doi: 10.3389/fnbeh.2024.1380031. eCollection 2024. Front Behav Neurosci. 2024. PMID: 38817806 Free PMC article.
-
Stress-related neuropeptides and addictive behaviors: beyond the usual suspects.Neuron. 2012 Oct 4;76(1):192-208. doi: 10.1016/j.neuron.2012.09.026. Neuron. 2012. PMID: 23040815 Free PMC article. Review.
-
Social housing and alcohol drinking in male-female pairs of prairie voles (Microtus ochrogaster).Psychopharmacology (Berl). 2012 Nov;224(1):121-32. doi: 10.1007/s00213-012-2836-4. Epub 2012 Aug 18. Psychopharmacology (Berl). 2012. PMID: 22903359 Free PMC article.
References
-
- Aalto J. Circadian drinking rhythms and blood alcohol levels in two rat lines developed for their alcohol consumption. Alcohol. 1986;3(1):73–5. - PubMed
-
- Advani T, Hensler JG, Koek W. Effect of early rearing conditions on alcohol drinking and 5-HT1A receptor function in C57BL/6J mice. Int J Neuropsychopharmacol. 2007;10(5):595–607. - PubMed
-
- Agabio R, Cortis G, Fadda F, Gessa GL, Lobina C, Reali R, Colombo G. Circadian drinking pattern of Sardinian alcohol-preferring rats. Alcohol Alcohol. 1996;31(4):385–8. - PubMed
Publication types
MeSH terms
Substances
Grants and funding
LinkOut - more resources
Full Text Sources
Medical

