. 2010 Jul 9;87(1):17-25.
doi: 10.1016/j.ajhg.2010.05.018. Epub 2010 Jun 24.

Population genetic structure of the people of Qatar

Affiliations

Population genetic structure of the people of Qatar

Haley Hunter-Zinck et al. Am J Hum Genet. .

Abstract

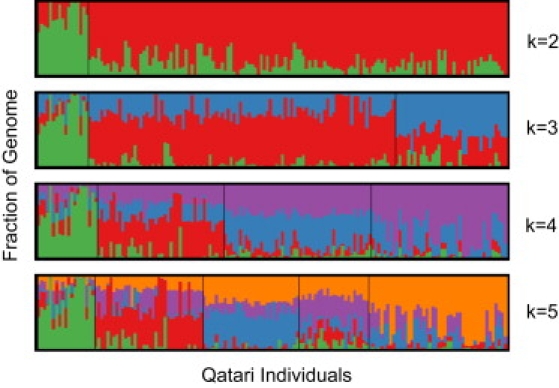
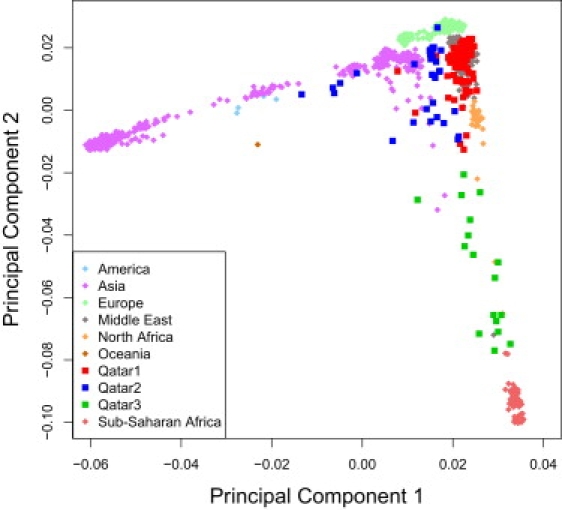
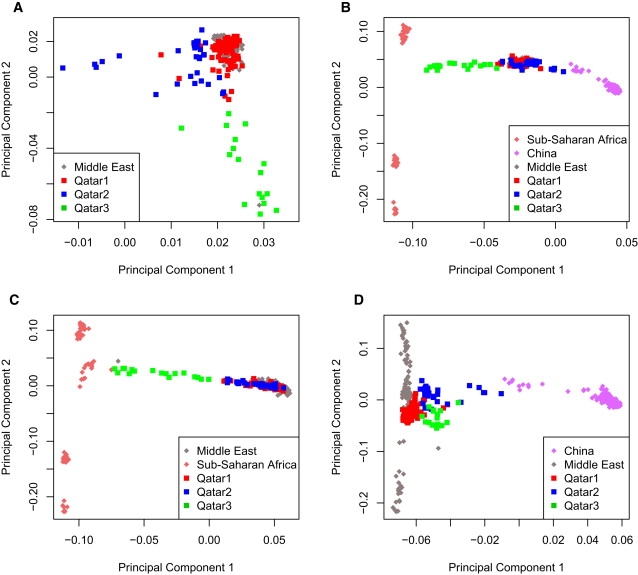
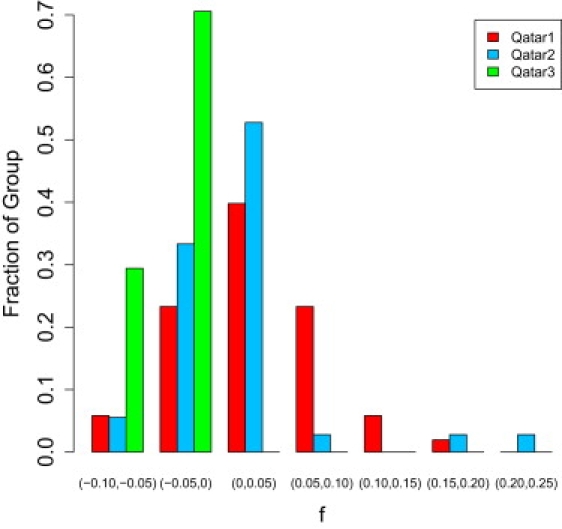
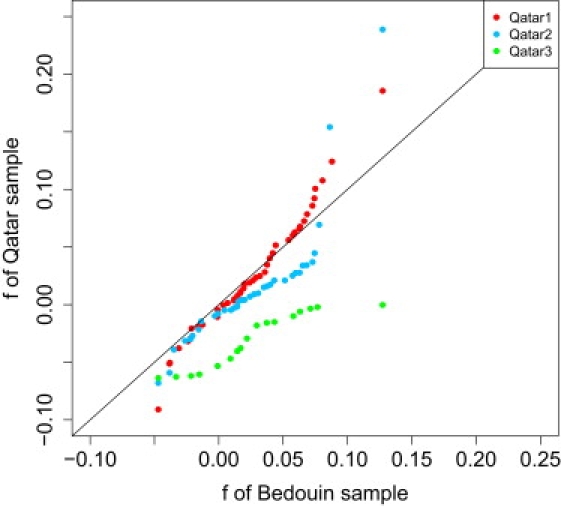
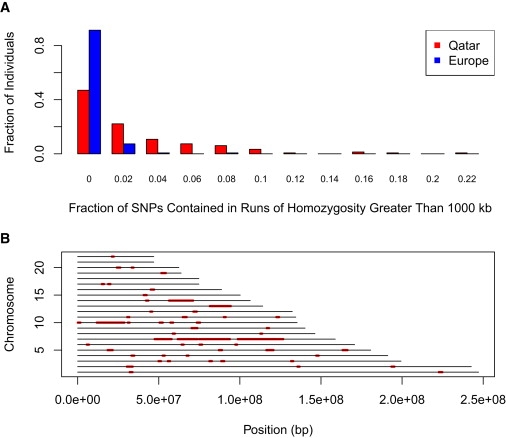
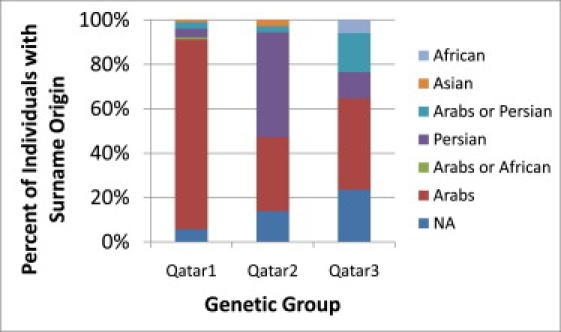
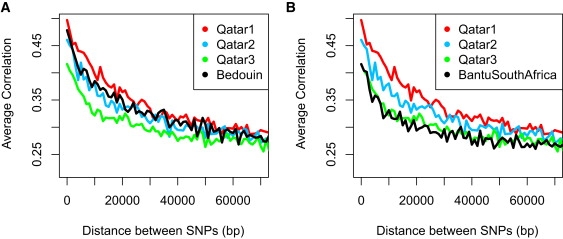
People of the Qatar peninsula represent a relatively recent founding by a small number of families from three tribes of the Arabian Peninsula, Persia, and Oman, with indications of African admixture. To assess the roles of both this founding effect and the customary first-cousin marriages among the ancestral Islamic populations in Qatar's population genetic structure, we obtained and genotyped with Affymetrix 500k SNP arrays DNA samples from 168 self-reported Qatari nationals sampled from Doha, Qatar. Principal components analysis was performed along with samples from the Human Genetic Diversity Project data set, revealing three clear clusters of genotypes whose proximity to other human population samples is consistent with Arabian origin, a more eastern or Persian origin, and individuals with African admixture. The extent of linkage disequilibrium (LD) is greater than that of African populations, and runs of homozygosity in some individuals reflect substantial consanguinity. However, the variance in runs of homozygosity is exceptionally high, and the degree of identity-by-descent sharing generally appears to be lower than expected for a population in which nearly half of marriages are between first cousins. Despite the fact that the SNPs of the Affymetrix 500k chip were ascertained with a bias toward SNPs common in Europeans, the data strongly support the notion that the Qatari population could provide a valuable resource for the mapping of genes associated with complex disorders and that tests of pairwise interactions are particularly empowered by populations with elevated LD like the Qatari.


Figures

Figure 1
Figure 1
STRUCTURE Results Analysis of admixture with the program STRUCTURE assuming two, three, four, and five subpopulations. The plot represents each individual as a thin vertical column. The proportion of each color in each column indicates the proportion of an individual's genome originating from one particular (but arbitrarily colored) subpopulation. For k = 3, we arbitrarily labeled these subpopulations Qatar1 (red), Qatar2 (blue), and Qatar3 (green) and assigned each individual to a subpopulation based on plurality.
Figure 2
Figure 2
Principal Components Analysis of HGDP and Qatari samples Principal components analysis plot of Qatar1, Qatar2, and Qatar3 (as defined by the STRUCTURE analysis in Figure 1) and population samples from the Human Genomic Diversity Project (HGDP). Qatar1 clusters well with other Middle Eastern samples. Qatar2 spreads away from the Middle Eastern cluster toward the Asian samples. Qatar3 spreads away from the Middle Eastern cluster toward the African samples. The interdigitation of the Qatar2 and Qatar3 samples could indicate recent admixture.
Figure 3
Figure 3
Principal Components Analysis Plots Revealing Relations to the HGDP Samples and the Extent of Qatari Subgroup Admixture (A) Principal components were calculated based on all HGDP populations and the Qatari data. Only Qatari data and HGDP Middle Eastern samples are graphed on this plot. Qatar1 clusters well with the other Middle Eastern populations, whereas Qatar2 creates a small cluster slightly removed from Qatar1 and the other Middle Eastern samples. Qatar3 does not form a definite cluster and is far removed from the main Middle Eastern cluster. (B) Principal components were calculated only on Chinese and sub-Saharan African population samples. Qatari groups were then graphed on the plot by using the principal components but were not used in the calculation of the principal components. The Qatar1 and Qatar2 groups cluster directly on top of the other Middle Eastern samples, which spread between the African and Asian groups. Qatar3 spreads between the Middle Eastern samples and the African samples. (C) Principal components were calculated only on sub-Saharan African and Middle Eastern populations. Qatari groups were then plotted onto these principal components. The Qatar3 group shows possible signs of admixture between the Middle Eastern cluster and the African population, whereas the Qatar1 and Qatar2 groups cluster well with the other Middle Eastern populations. (D) Principal components were calculated only on Chinese and Middle Eastern populations. Qatari groups were then plotted onto these principal components. The Qatar2 group shows a few individuals who demonstrate signs of admixture between the Middle Eastern samples and the Chinese samples but mostly cluster with the other Middle Easterners.
Figure 4
Figure 4
Distribution of the Degree of Consanguinity in Each Qatari Subgroup The distributions of consanguinity are significantly different across the three Qatari subgroups. Qatar1 shows the highest degree of consanguinity, whereas every individual in Qatar3 has an unusually low level of consanguinity. Two tests of the statistical significance of differences in consanguinity among these groups were performed: Kruskal-Wallis test, p < 0.001; analysis of variance, p < 0.001.
Figure 5
Figure 5
Analysis of the Degree of Consanguinity across the Qatari Subgroups as Compared to the HGDP Bedouin Sample Quantile-quantile plot comparing the Wright's inbreeding coefficient (f) as calculated with PLINK for each individual in each Qatari subgroup with the coefficients of each individual in the HGDP Bedouin sample. The plot indicates that the Qatar1 subgroup contains individuals with higher levels of consanguinity than individuals in the Bedouin sample. The Qatar2 subgroup contains individuals with a lesser degree of consanguinity (the trend of points below the diagonal) compared to individuals in the Bedouin sample, although there are two outlying individuals with unusually high consanguinity. Finally, the Qatar3 subgroup appears to be far less consanguineous than the Bedouin sample.
Figure 6
Figure 6
Spans of Genomes that Are Homozygous (A) The fraction of each individual's genome that is contained within runs of homozygosity is plotted as a histogram for a sample of approximately 150 Qataris and 150 European Americans. The minimum length of each is 1000 kb or 100 SNPs. The Qataris exhibit greater variance in homozygosity relative to the European Americans. (B) Runs of homozygosity for a single Qatari individual. The x axis is the position along a chromosome (0−250 Mbp), and the y axis is the chromosome number. Each red segment represents a block of sequence in which SNP marker genotypes are homozygous.
Figure 7
Figure 7
Surnames and Genetic Classifications Composition of surnames within each of the three Qatari groups is indicated by color coding according to surname frequency within those groups. The genetic classification of Qatar1, Qatar2, and Qatar3 is significantly correlated with surname origins (Mantel test, p < 0.0001).
Figure 8
Figure 8
Linkage Disequilibrium Decay across the Genomes of the Qatari Subgroups and Two HGDP Population Samples (A) Linkage disequilibrium (LD) for pairs of SNPs less than 70 kb apart was calculated as the squared correlation coefficient (r2). Calculations were performed on a standard sample size (n = 5) of randomly selected individuals in each Qatari group. SNP pairs were partitioned into bins in 1 kb intervals, and for each bin the mean r2 was plotted. The Qatar1 group has the highest LD, consistent with their higher degree of consanguinity. Qatar2 is intermediate, and the Qatar3 group has the lowest LD between SNPs, consistent with a large African component in their genome. The Bedouin HGDP population sample appears to fall between that of the Qatar1 and Qatar2 groups. (B) The decay of LD of the three Qatari samples is replotted here along with the Bantu South African sample of the HGDP set. The LD decay of the Bantu South African population sample overlaps with that of Qatar3, consistent with the Qatar3 sample being of largely African origin.

Similar articles

Cited by

References

    1. Zeggini E., Scott L.J., Saxena R., Voight B.F., Marchini J.L., Hu T., de Bakker P.I., Abecasis G.R., Almgren P., Andersen G., Wellcome Trust Case Control Consortium Meta-analysis of genome-wide association data and large-scale replication identifies additional susceptibility loci for type 2 diabetes. Nat. Genet. 2008;40:638–645. - PMC - PubMed
    1. Meyre D., Delplanque J., Chèvre J.C., Lecoeur C., Lobbens S., Gallina S., Durand E., Vatin V., Degraeve F., Proença C. Genome-wide association study for early-onset and morbid adult obesity identifies three new risk loci in European populations. Nat. Genet. 2009;41:157–159. - PubMed
    1. Larson M.G., Atwood L.D., Benjamin E.J., Cupples L.A., D'Agostino R.B., Sr., Fox C.S., Govindaraju D.R., Guo C.Y., Heard-Costa N.L., Hwang S.J. Framingham Heart Study 100K project: Genome-wide associations for cardiovascular disease outcomes. BMC Med. Genet. 2007;8(Suppl 1):S5. - PMC - PubMed
    1. Manolio T.A., Collins F.S., Cox N.J., Goldstein D.B., Hindorff L.A., Hunter D.J., McCarthy M.I., Ramos E.M., Cardon L.R., Chakravarti A. Finding the missing heritability of complex diseases. Nature. 2009;461:747–753. - PMC - PubMed
    1. Badii R., Bener A., Zirie M., Al-Rikabi A., Simsek M., Al-Hamaq A.O., Ghoussaini M., Froguel P., Wareham N.J. Lack of association between the Pro12Ala polymorphism of the PPAR-gamma 2 gene and type 2 diabetes mellitus in the Qatari consanguineous population. Acta Diabetol. 2008;45:15–21. - PubMed

Publication types