. 2010 Oct;14(5):643-53.
doi: 10.1016/j.media.2010.05.008. Epub 2010 Jun 4.

Manifold modeling for brain population analysis

Affiliations

Manifold modeling for brain population analysis

Samuel Gerber et al. Med Image Anal. 2010 Oct.

Abstract

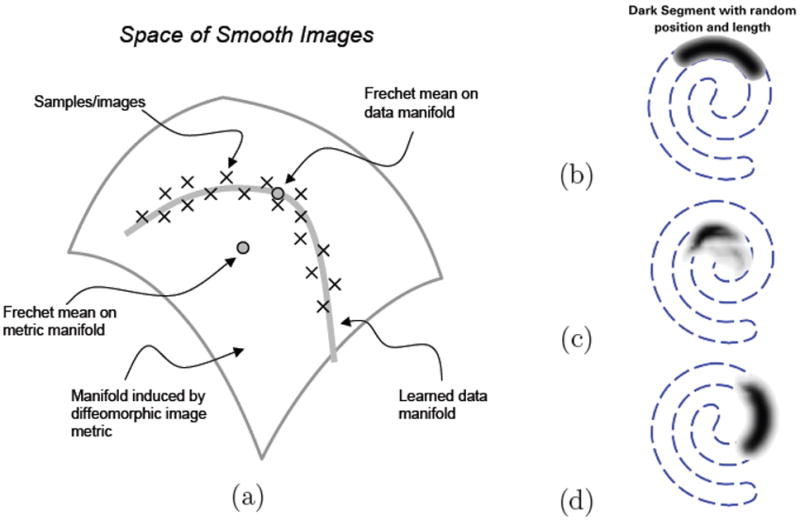
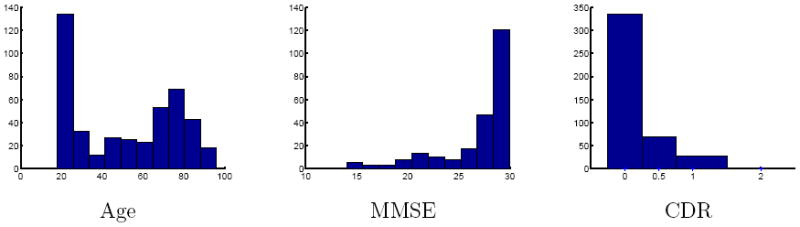
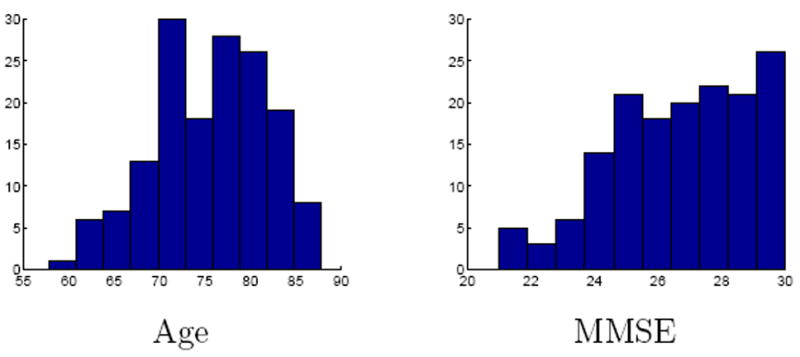
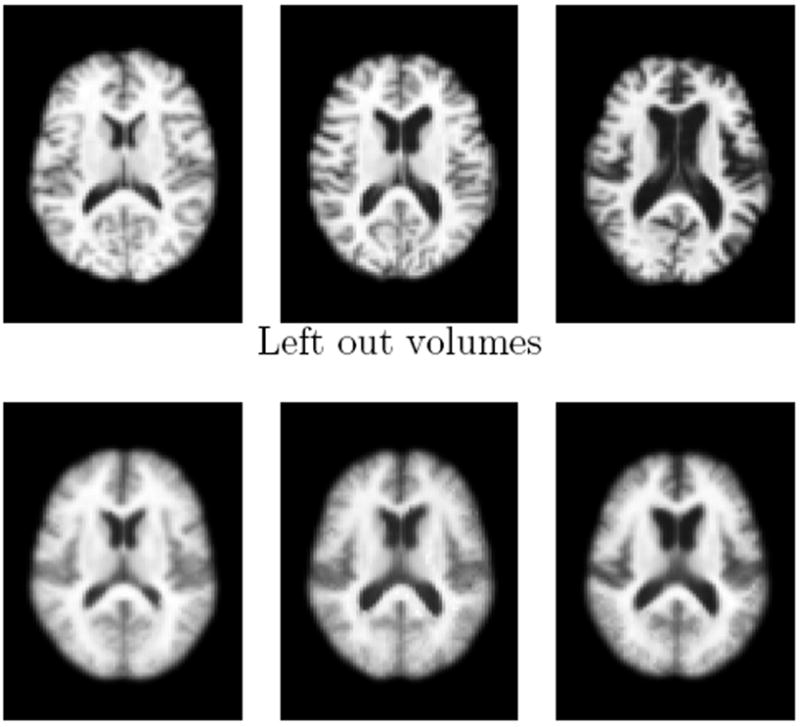
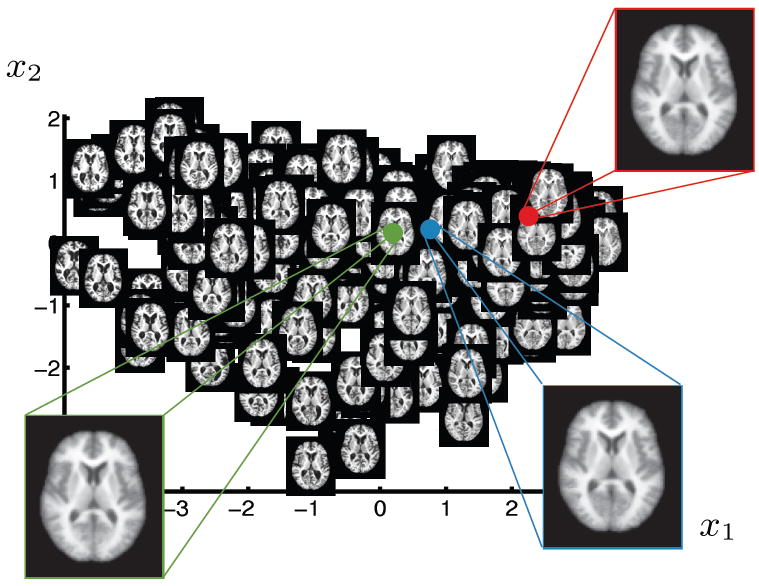
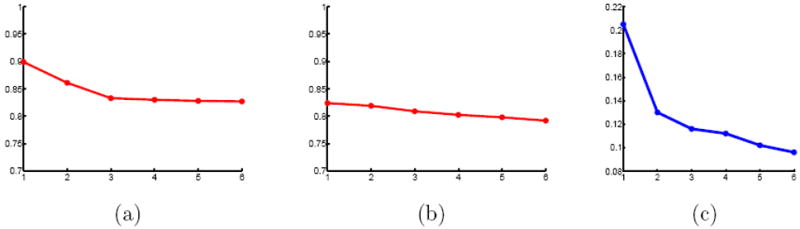
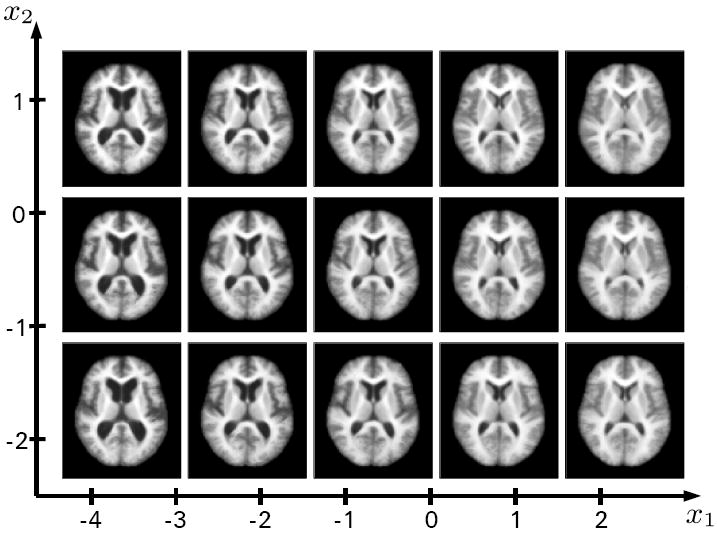
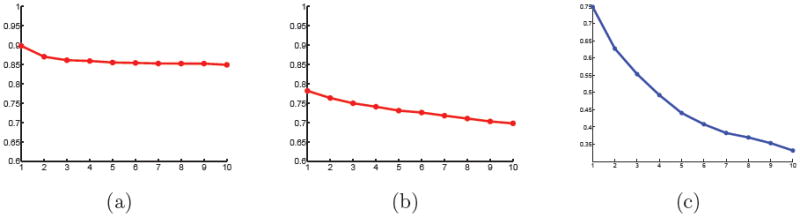
This paper describes a method for building efficient representations of large sets of brain images. Our hypothesis is that the space spanned by a set of brain images can be captured, to a close approximation, by a low-dimensional, nonlinear manifold. This paper presents a method to learn such a low-dimensional manifold from a given data set. The manifold model is generative-brain images can be constructed from a relatively small set of parameters, and new brain images can be projected onto the manifold. This allows to quantify the geometric accuracy of the manifold approximation in terms of projection distance. The manifold coordinates induce a Euclidean coordinate system on the population data that can be used to perform statistical analysis of the population. We evaluate the proposed method on the OASIS and ADNI brain databases of head MR images in two ways. First, the geometric fit of the method is qualitatively and quantitatively evaluated. Second, the ability of the brain manifold model to explain clinical measures is analyzed by linear regression in the manifold coordinate space. The regression models show that the manifold model is a statistically significant descriptor of clinical parameters.


Figures

Figure 1
Figure 1
(a) Illustration of image data on a low-dimensional manifold embedded in a diffeomorphic space. (b) A set of images consists of random length/position segments from a spiral. (c) The Fréchet mean in the space induced by a metric based on coordinate transformations is not like any example from the set. (d) Fréchet mean on data-driven manifold reflects the image with average parameter values.
Figure 2
Figure 2
Sampling along the first dimension of the manifold learned from images of spiral segments. The images shown are constructed, as discussed in section 3, from the learned manifold parametrization.
Figure 3
Figure 3
Histograms of age, MMSE and CDR for the OASIS data set.
Figure 4
Figure 4
Histograms of age, MMSE and diagnosis for the ADNI data set.
Figure 5
Figure 5
Reconstructions (bottom row) of three left out images (top row) with small, medium and large ventricle sizes. The corresponding projection distances are 1.07, 0.81 and 1.23 respectively. Note that the manifold model does not have enough data to represent the subject on the right, which shows a, for this data set atypical, separation between the anterior and posterior horn.
Figure 6
Figure 6
2D parametrization of OASIS brain MRI database obtained by the proposed approach. For each brain image axial slice number 80 is visualized at the corresponding location on the 2D manifold. The insets show the mean (green), median (blue) and mode (red) of the learned manifold and the corresponding reconstructed images.
Figure 7
Figure 7
Projection distances, scaled by average nearest neighbor distance (12), for the OASIS data set against dimensionality for (a) the proposed method and (b) PCA. The isomap residual (c) shows the distortion required to embed the manifold in Euclidean space.
Figure 8
Figure 8
Reconstructions using the proposed method on equally spaced grid locations on the 2D representation shown in Figure 6.
Figure 9
Figure 9
Projection distances on ADNI data set, scaled by average nearest neighbor distance, against dimensionality for (a) the proposed method and (b) PCA. (c) Isomap embedding distortion plotted as a function of dimensionality.
Figure 10
Figure 10
Parametrization along dimensions (a) 1, 2 and (b) 1, 6 of the manifold coordinates of the ADNI data set. For each brain image axial slice number 80 is visualized at the corresponding location on the 2D manifold. The parametrization in (b) shows the two statistical significant manifold coordinate dimensions to explain diagnosis.
Figure 11
Figure 11
Kernel density estimate of subjects from the OASIS database projected onto a 2D manifold representation.
Figure 12
Figure 12
Residuals from the manifold regression model against the PCA regression model for (a) MMSE and (b) diagnosis. The bottom row shows three selected images with large residuals. The first image has a very low MMSE score that is not well represented in the image set. The second image shows a subject with large ventricle scores but a perfect MMSE scores. Both approaches relate ventricle size to lower MMSE scores and thus predict a lower MMSE score. The third subject shows the inverse, a subject with small ventricles but a relatively low MMSE score.
Figure 13
Figure 13
Slice number 80 of the reconstructed images along the statistically significant manifold coordinates (first and sixth dimension) for explaining the diagnosis. The shading indicates the gradient of the corresponding linear model on diagnosis (row 8 in Table 3).

Similar articles

Cited by

References

    1. Lorenzen P, Davis BC, Joshi S. Unbiased atlas formation via large deformations metric mapping. MICCAI. 2005:411–418. - PubMed
    1. Joshi S, Davis B, Jomier M, Gerig G. Unbiased diffeomorphic atlas construction for computational anatomy. NeuroImage. 2004;23(Supplement 1):S151–S160. mathematics in Brain Imaging. - PubMed
    1. Avants B, Gee JC. Geodesic estimation for large deformation anatomical shape averaging and interpolation. NeuroImage. 2004;23(Supplement 1):S139–S150. - PubMed
    1. Blezek DJ, Miller JV. Atlas stratification. Medical Image Analysis. 2007;11(5):443–457. - PMC - PubMed
    1. Sabuncu MR, Balci SK, Golland P. Discovering modes of an image population through mixture modeling. MICCAI (2) 2008:381–389. - PMC - PubMed

Publication types

MeSH terms