

Segmentation of image ensembles via latent atlases
- PMID: 20580305
- PMCID: PMC2932709
- DOI: 10.1016/j.media.2010.05.004
Segmentation of image ensembles via latent atlases
Abstract
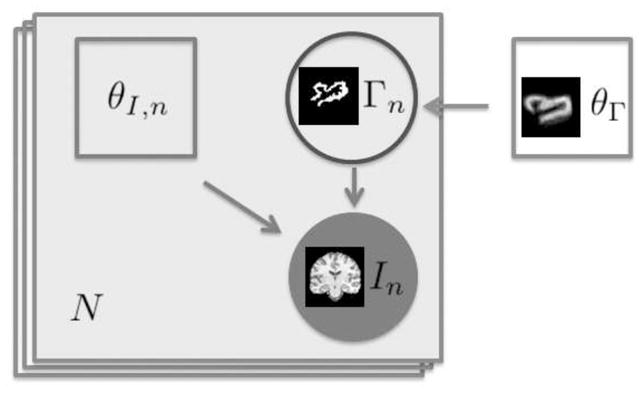
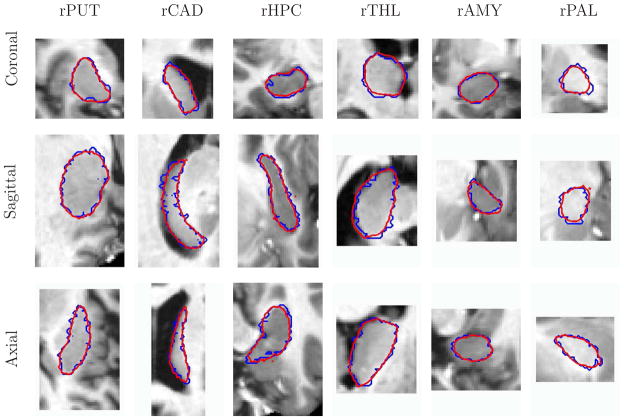
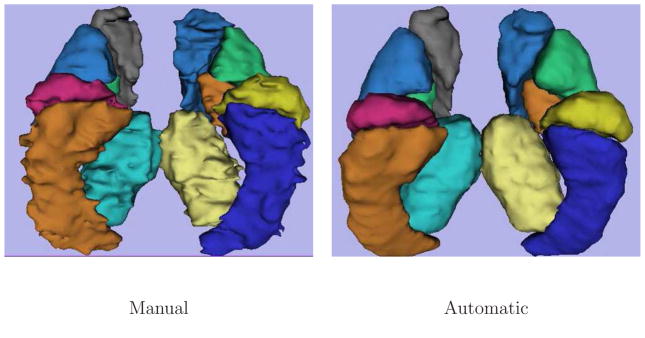
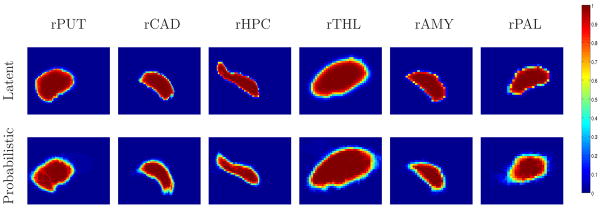
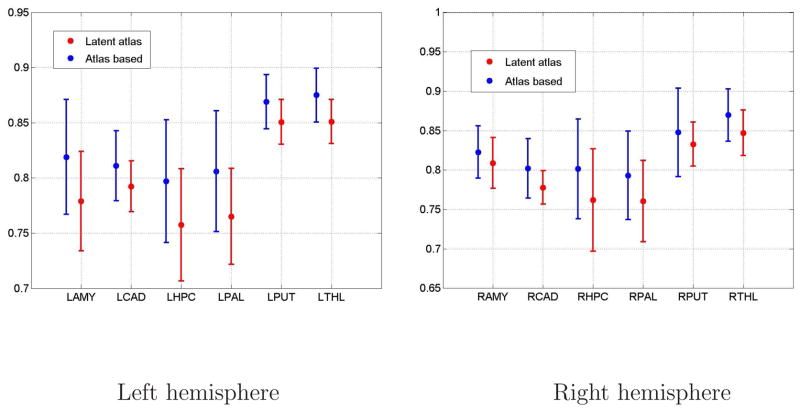
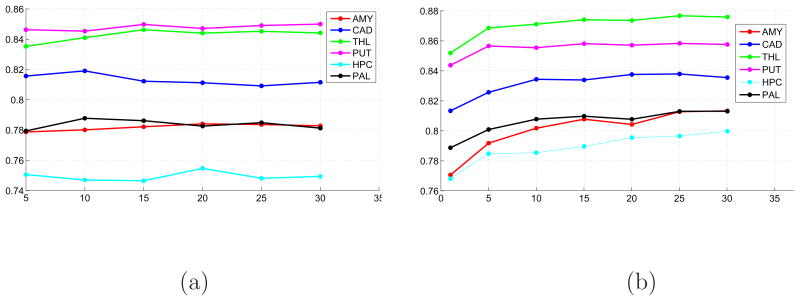
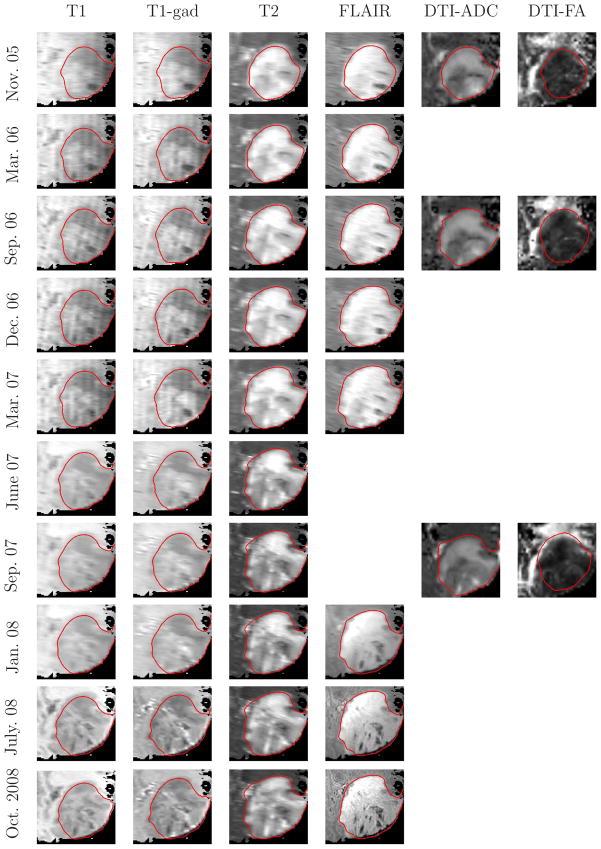
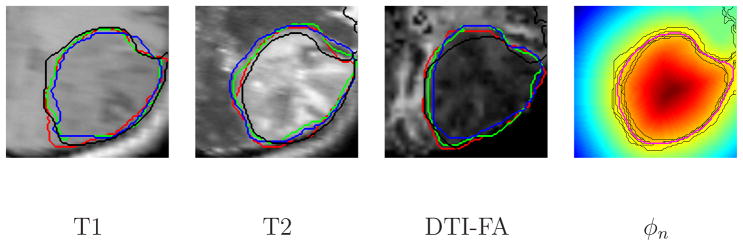
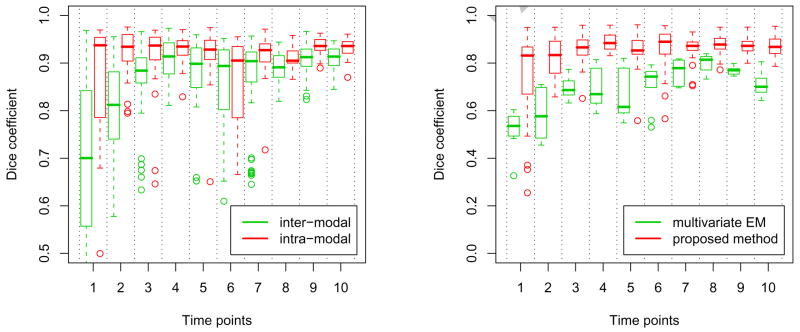
Spatial priors, such as probabilistic atlases, play an important role in MRI segmentation. However, the availability of comprehensive, reliable and suitable manual segmentations for atlas construction is limited. We therefore propose a method for joint segmentation of corresponding regions of interest in a collection of aligned images that does not require labeled training data. Instead, a latent atlas, initialized by at most a single manual segmentation, is inferred from the evolving segmentations of the ensemble. The algorithm is based on probabilistic principles but is solved using partial differential equations (PDEs) and energy minimization criteria. We evaluate the method on two datasets, segmenting subcortical and cortical structures in a multi-subject study and extracting brain tumors in a single-subject multi-modal longitudinal experiment. We compare the segmentation results to manual segmentations, when those exist, and to the results of a state-of-the-art atlas-based segmentation method. The quality of the results supports the latent atlas as a promising alternative when existing atlases are not compatible with the images to be segmented.
Copyright 2010 Elsevier B.V. All rights reserved.
Figures
Similar articles
-
Joint segmentation of image ensembles via latent atlases.Med Image Comput Comput Assist Interv. 2009;12(Pt 1):272-80. doi: 10.1007/978-3-642-04268-3_34. Med Image Comput Comput Assist Interv. 2009. PMID: 20425997 Free PMC article.
-
Multi-atlas based segmentation of brain images: atlas selection and its effect on accuracy.Neuroimage. 2009 Jul 1;46(3):726-38. doi: 10.1016/j.neuroimage.2009.02.018. Epub 2009 Feb 23. Neuroimage. 2009. PMID: 19245840
-
Automatic hippocampus segmentation of 7.0 Tesla MR images by combining multiple atlases and auto-context models.Neuroimage. 2013 Dec;83:335-45. doi: 10.1016/j.neuroimage.2013.06.006. Epub 2013 Jun 11. Neuroimage. 2013. PMID: 23769921 Free PMC article.
-
Segmentation of brain images using adaptive atlases with application to ventriculomegaly.Inf Process Med Imaging. 2011;22:1-12. doi: 10.1007/978-3-642-22092-0_1. Inf Process Med Imaging. 2011. PMID: 21761641 Free PMC article.
-
Multi-atlas segmentation of biomedical images: A survey.Med Image Anal. 2015 Aug;24(1):205-219. doi: 10.1016/j.media.2015.06.012. Epub 2015 Jul 6. Med Image Anal. 2015. PMID: 26201875 Free PMC article. Review.
Cited by
-
Imaging genomics in cancer research: limitations and promises.Br J Radiol. 2016;89(1061):20151030. doi: 10.1259/bjr.20151030. Epub 2016 Feb 11. Br J Radiol. 2016. PMID: 26864054 Free PMC article. Review.
-
Automatic morphometry in Alzheimer's disease and mild cognitive impairment.Neuroimage. 2011 Jun 15;56(4):2024-37. doi: 10.1016/j.neuroimage.2011.03.014. Epub 2011 Mar 11. Neuroimage. 2011. PMID: 21397703 Free PMC article.
-
Semiautomatic segmentation and follow-up of multicomponent low-grade tumors in longitudinal brain MRI studies.Med Phys. 2014 May;41(5):052303. doi: 10.1118/1.4871040. Med Phys. 2014. PMID: 24784396 Free PMC article.
-
The Multimodal Brain Tumor Image Segmentation Benchmark (BRATS).IEEE Trans Med Imaging. 2015 Oct;34(10):1993-2024. doi: 10.1109/TMI.2014.2377694. Epub 2014 Dec 4. IEEE Trans Med Imaging. 2015. PMID: 25494501 Free PMC article. Review.
-
OPTIMAL PARAMETER MAP ESTIMATION FOR SHAPE REPRESENTATION: A GENERATIVE APPROACH.Proc IEEE Int Symp Biomed Imaging. 2016 Apr;2016:660-663. doi: 10.1109/ISBI.2016.7493353. Epub 2016 Jun 16. Proc IEEE Int Symp Biomed Imaging. 2016. PMID: 28090247 Free PMC article.
References
-
- Ashburner J, Friston K. Unified segmentation. NeuroImage. 2005;26:839–851. - PubMed
-
- Bazin P, Pham D. Statistical and topological atlas based brain image segmentation. LNCS; Proceedings of International on Medical Image Computing and Computer-Assisted Intervention; Springer; 2007. pp. 94–101. - PubMed
-
- Besag J. Statistical analysis of non-lattice data. The Statistician. 1975;24 (3):179–195.
-
- Bhatia K, Aljabar P, Boardman J, Srinivasan L, Murgasova M, Counsell S, Rutherford M, Hajnal J, Edwards A, Rueckert D. Groupwise combined segmentation and registration for atlas construction. LNCS; Proceedings of International on Medical Image Computing and Computer-Assisted Intervention; Springer; 2007. pp. 532–540. - PubMed
-
- Chan T, Vese L. Active contours without edges. IEEE Transactions on Image Processing. 2001;10 (2):266–277. - PubMed
Publication types
MeSH terms
Grants and funding
LinkOut - more resources
Full Text Sources
Other Literature Sources
Medical
